
Select a trading day to view all Scanner results, chart evidence, and market explanations.
4 Scanners Available
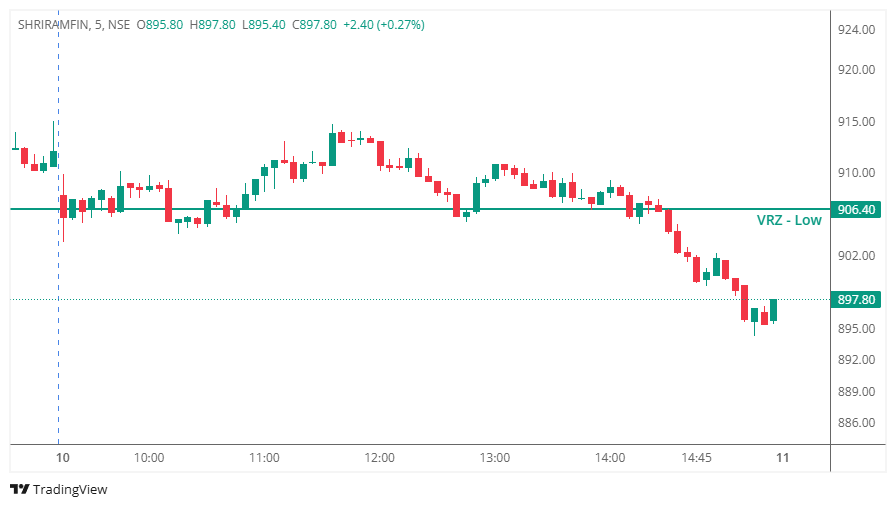
Price attempted to hold above the VRZ Low but failed to attract buyers. The rejection around the zone confirmed weakness, triggering a BOF short setup. Once sellers gained control, the stock moved steadily downward and delivered a 2.5R move without any major bullish interruption.
A BOF setup becomes powerful when:
This trade is another example of how a failed move often creates a stronger move in the opposite direction.
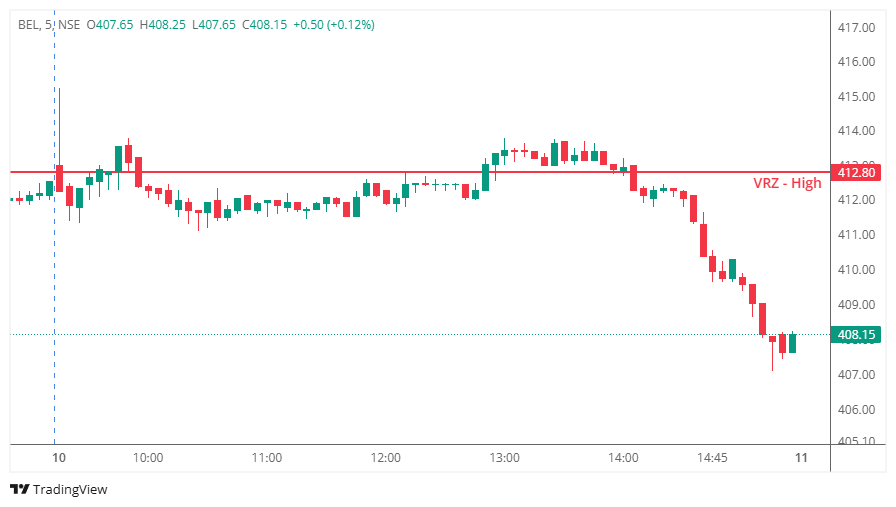
BEL approached a previously identified VRZ High at ₹412.80 and spent a significant portion of the session trading around this critical resistance zone.
During the afternoon session, buyers attempted to push the stock above the VRZ High, creating the appearance of a potential breakout. Price briefly traded above the resistance area and attracted traders expecting a continuation toward higher levels.
However, the breakout lacked conviction.
Instead of establishing acceptance above ₹412.80, the stock repeatedly struggled to sustain higher prices. Every attempt to move away from the VRZ was met with selling pressure, indicating that sellers were actively defending the zone.
As the session progressed, price slipped back below the VRZ High and began forming lower highs around the resistance area.
This confirmed a classic Breakout Failure (BOF) setup.
Once the breakout failed, bearish momentum accelerated sharply. Selling pressure increased during the final hour of trading, resulting in a strong downside move from the VRZ area toward the session lows.
The inability to hold above resistance transformed what initially appeared to be a bullish breakout into a high-probability BOF opportunity.
Most traders are naturally attracted to visible breakouts.
As BEL traded above ₹412.80, many market participants believed:
The market had a different plan.
When price repeatedly failed to sustain above the VRZ:
Started questioning the strength of the move.
Found themselves holding positions near resistance.
Became more aggressive as weakness emerged.
The psychology shifted from:
"The breakout is working."
to
"The breakout is failing."
This transition created the fuel for the sharp decline that followed.
The market often punishes traders who react to the breakout itself and rewards traders who wait for confirmation.
A breakout that repeatedly struggles above resistance often signals weakening buyer conviction.
BEL provided several clues before the actual downside expansion began.
Many traders focus on whether price crosses resistance.
Professional traders focus on whether the market can sustain above that level.
BEL failed to achieve acceptance above ₹412.80.
When bullish expectations are invalidated, trapped buyers often become sellers.
This additional supply can accelerate downside momentum.
The highest-probability trade did not occur during the breakout attempt.
The opportunity emerged after the market confirmed that the breakout had failed.
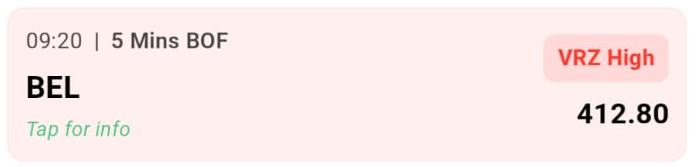
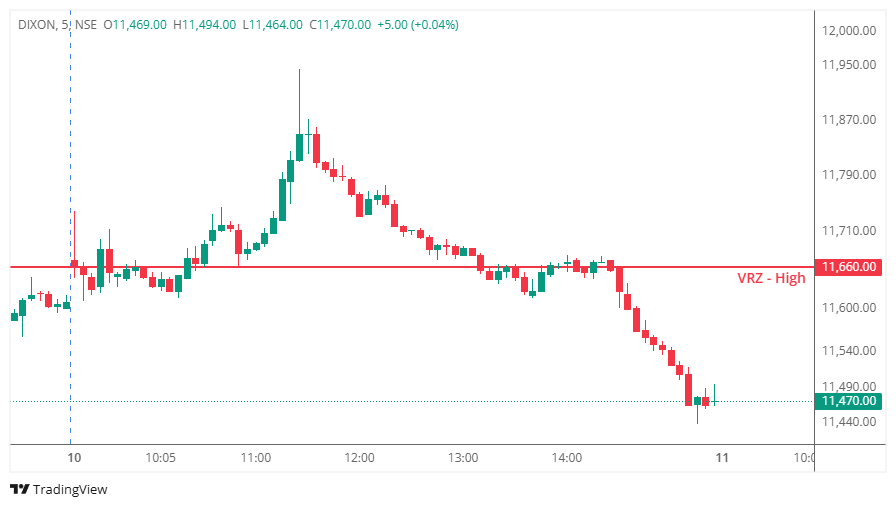
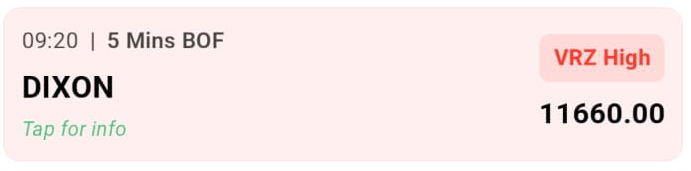
Price approached the VRZ High zone and initially showed signs of rejection. The BOF setup triggered as price failed to sustain above the level.
However, instead of attracting aggressive sellers, buyers stepped in and pushed the stock higher. The breakout failure itself failed, leading to a strong upward move and eventually hitting the stop loss.
Not every BOF setup will work. A failed BOF is a reminder that:
The objective is not to avoid losses but to keep losses small and let winners run. This trade was executed according to the rules, making it a good trade with a losing outcome, not a bad trade.
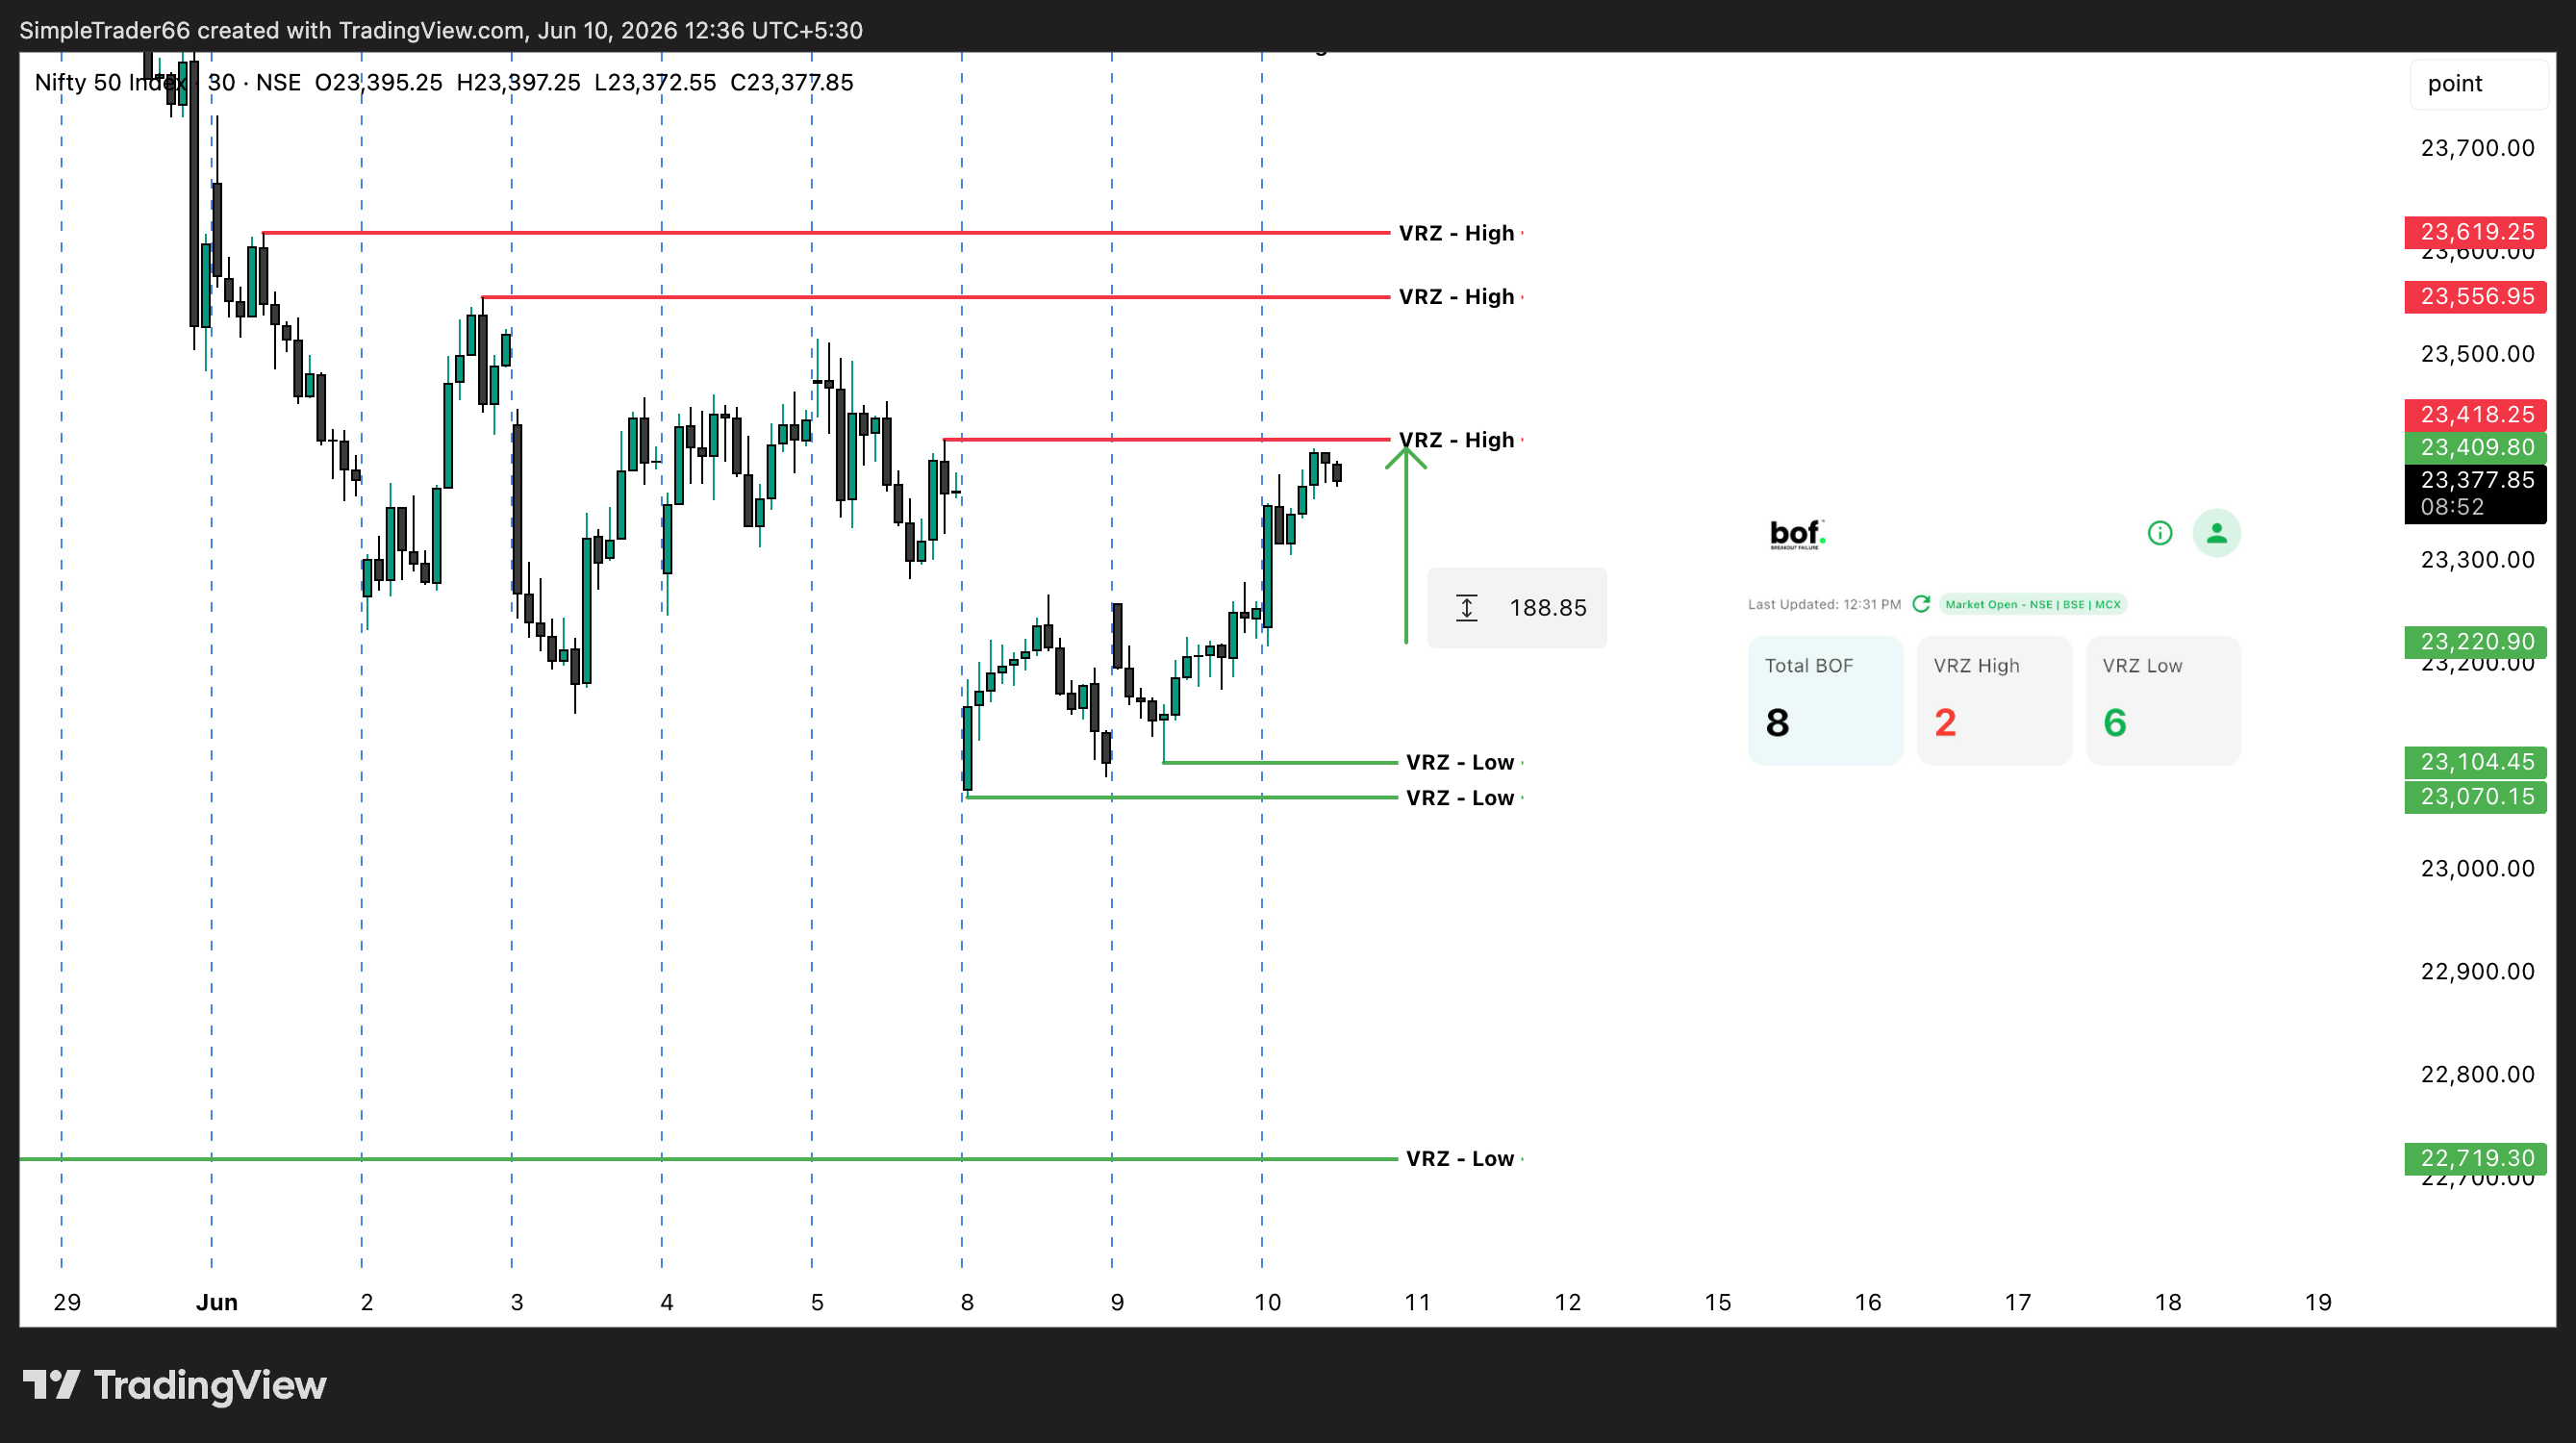

One of the most overlooked aspects of market analysis is understanding where the majority of reversal zones are forming.
In the current Nifty structure:
This imbalance immediately reveals an important clue.
The market is creating significantly more support zones than resistance zones.
That means buyers are consistently defending lower prices while sellers are struggling to establish meaningful resistance.
As a result, Nifty has already advanced approximately 188 points from the open.
A VRZ Low is created when price strongly rejects lower levels and reverses upward.
When multiple VRZ Lows begin appearing across the chart, it usually indicates:
More Participants are absorbing supply at lower levels.
Every decline attracts fresh buying interest.
The market repeatedly refuses to accept lower prices.
Even when price consolidates, underlying strength remains intact.
This is exactly what the Nifty chart is showing.
Many traders focus only on price movement.
Professional traders focus on market structure.
Before this rally occurred, the chart was already providing clues:
Six VRZ Lows compared to only two VRZ Highs.
This created a clear bullish imbalance.
With fewer VRZ Highs, price faced less overhead supply.
Every pullback generated fresh support zones rather than breakdown zones.
The market was quietly building energy before expanding higher.
The 188-point rally was not random.
It was the result of the underlying structure becoming increasingly bullish.
Most traders wait for price to move before becoming bullish.
Big pockets often accumulates before the move becomes obvious.
During the formation of multiple VRZ Lows:
By the time the rally became visible, the structural clues had already been present.
This is why understanding market context matters more than reacting to headlines.
Many traders focus on individual support and resistance levels.
A better approach is observing the overall balance.
Ask:
Is the market creating more support zones or more resistance zones?
The answer often reveals the dominant side.
Price movement is usually the final result.
Market structure is the cause.
The market rarely moves 188 points without leaving evidence beforehand.
The multiple VRZ Low formations provided those clues.
A bullish BOF setup has higher probability when the overall market structure is already showing strength.
Most traders manually analyze one chart at a time.
BOF Scanner continuously tracks:
This allows traders to identify potential directional bias before major moves develop.
Instead of asking:
"Why is Nifty moving?"
Traders can ask:
"What was the market structure telling us before the move?"
That question often provides better trading opportunities.
The recent Nifty rally demonstrates the importance of market structure analysis.
While many participants noticed the 188-point move after it happened, the chart had already been signaling strength through the creation of multiple VRZ Low zones.
With:
The market was clearly showing that buyers were gaining control.
The lesson is simple:
When support zones significantly outnumber resistance zones, the market is often preparing for higher prices.
Understanding this relationship can help traders align themselves with the underlying trend instead of reacting after the move has already occurred.