Select a trading day to view all Scanner results, chart evidence, and market explanations.
4 Scanners Available
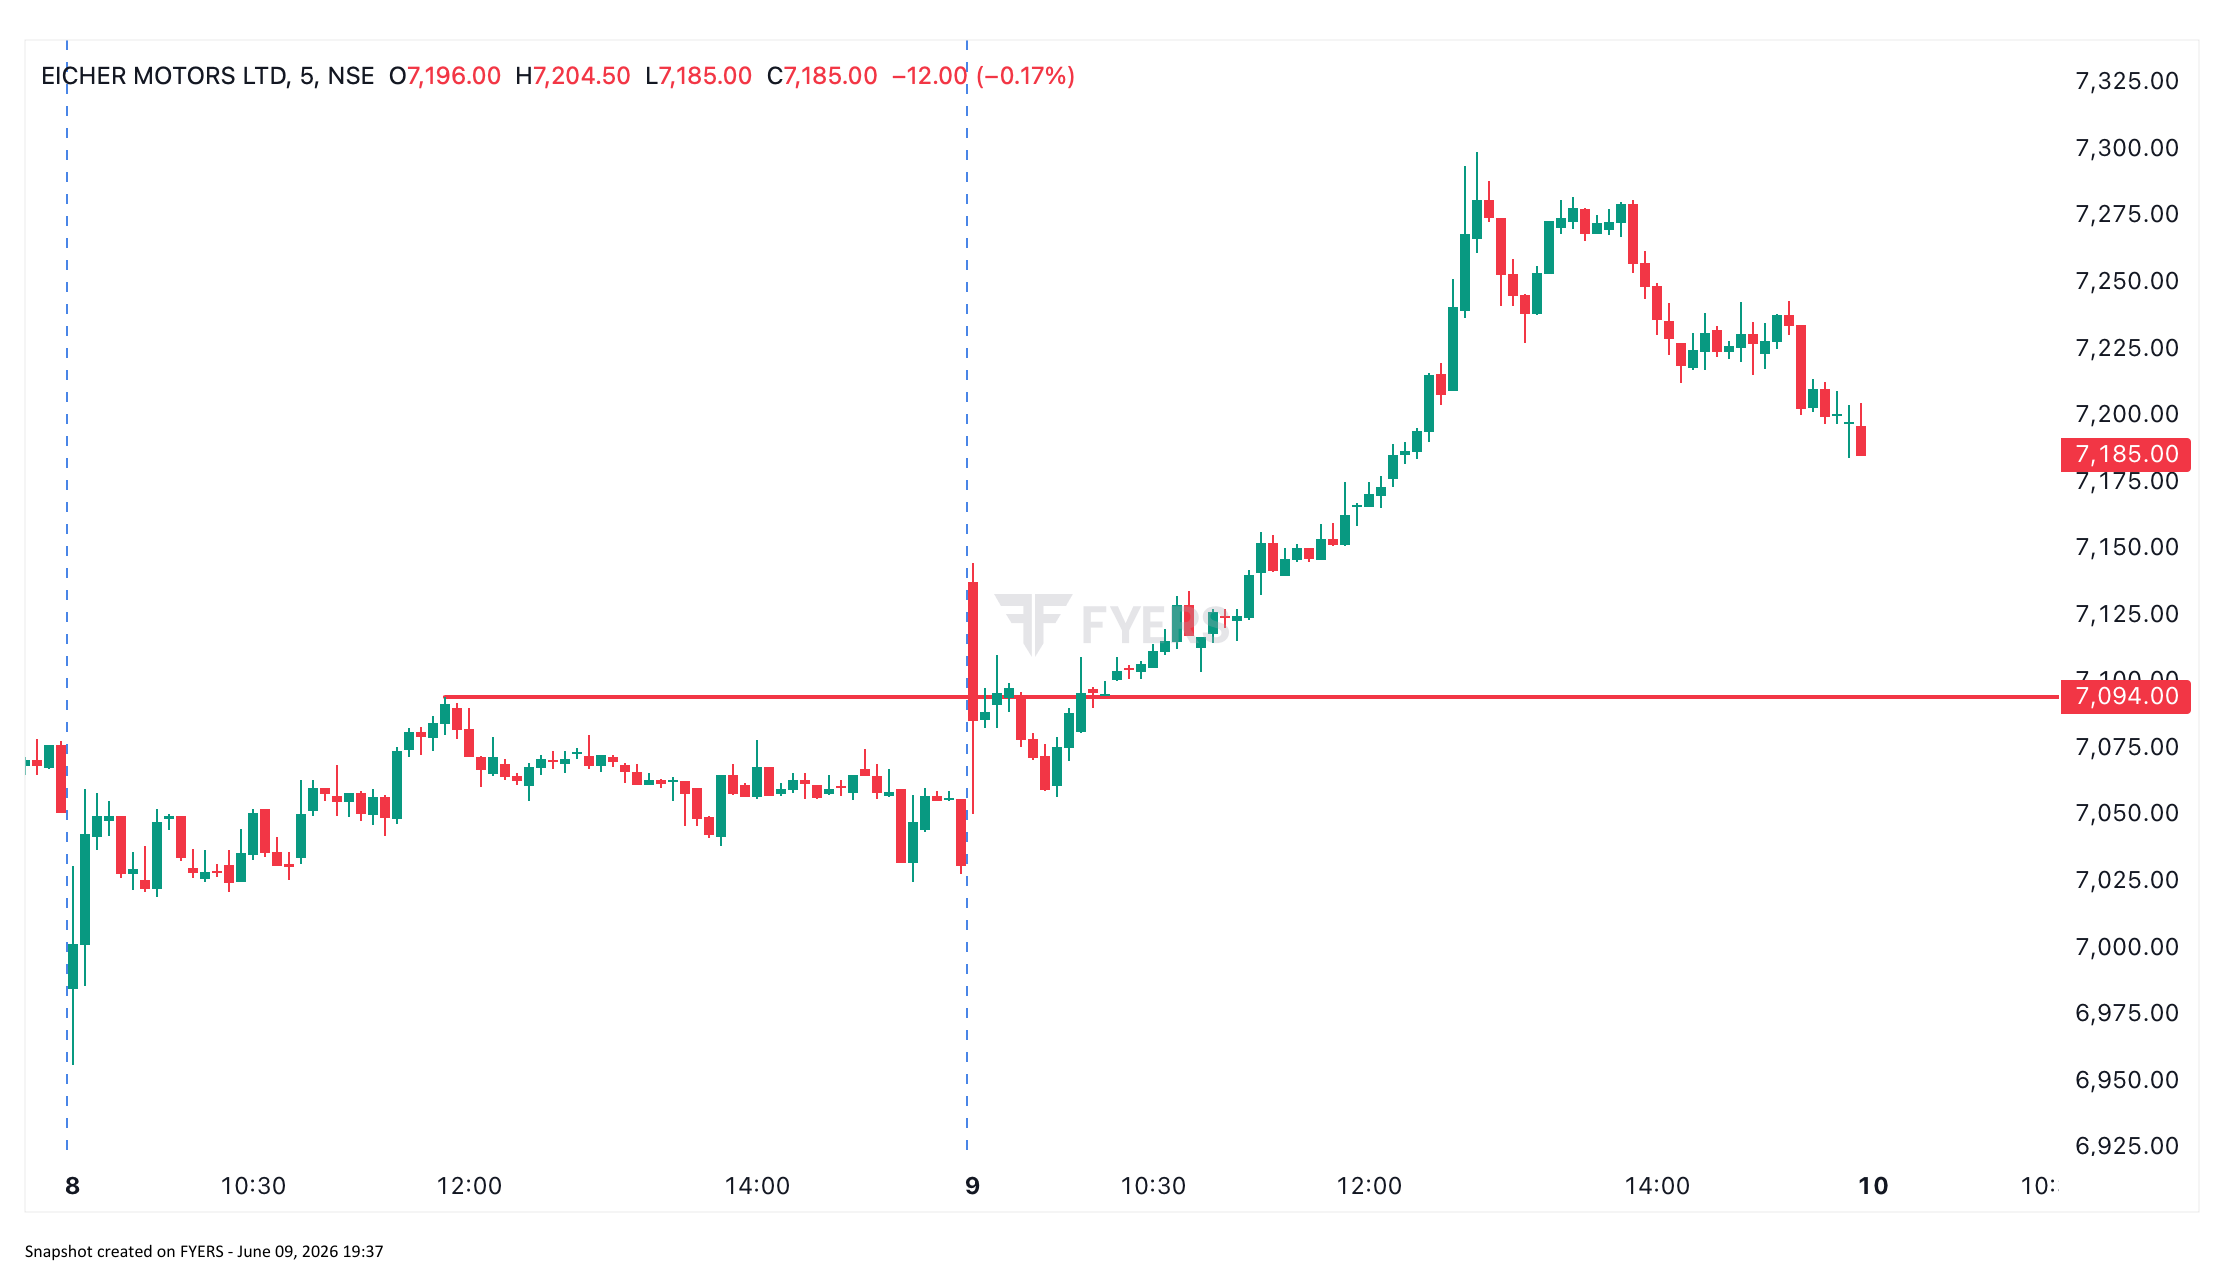
Stock Name: Eicher Motors Ltd (EICHERMOT)
Sector: Automobile & Auto Manufacturing
Time Frame: 5 Minutes
Setup Type: BOF at VRZ High
Zone: VRZ High – ₹7,094.00
EICHERMOT approached a previously identified VRZ High at ₹7,094.00 during the opening phase of the session and initially displayed characteristics of a textbook Breakout Failure (BOF) setup.
Price briefly moved above the resistance zone and then quickly slipped back below it, indicating potential weakness above the VRZ.
Based on BOF principles, the initial rejection suggested:
The setup provided a valid BOF entry according to the trading plan.
However, the market had a different objective.
Instead of attracting sustained selling pressure, EICHERMOT stabilized near the VRZ and gradually started reclaiming higher prices. Buyers absorbed the available supply and prevented the expected downside continuation.
As the session progressed, bullish momentum strengthened significantly. The stock moved decisively above the VRZ and continued trending higher throughout the day, eventually rallying more than ₹200 from the BOF area.
The result was a failed BOF setup, where the initial breakout failure signal did not generate the anticipated bearish follow-through.
The setup itself was valid.
The outcome was different.
This distinction is one of the most important lessons in trading.
In EICHERMOT:
✓ Breakout above resistance occurred.
✓ Rejection back below VRZ occurred.
✓ BOF conditions were present.
✓ Risk was clearly defined.
✓ Trade execution followed the plan.
✗ Sellers failed to gain control.
✗ Downside momentum never expanded.
✗ Buyers absorbed supply near the VRZ.
✗ Price reclaimed resistance and converted it into support.
✗ The stop loss was eventually triggered.
The setup was not invalid.
The market simply chose a different path.
One of the most costly beliefs in trading is:
"A good setup must produce a winning trade."
Professional traders understand that:
"A good setup only provides a statistical edge."
When EICHERMOT moved back below ₹7,094.00, many traders expected:
Instead, the opposite happened.
Absorbed available supply near the VRZ.
Became increasingly confident as the BOF appeared to be working.
Accumulated positions near support.
Were forced to cover as price moved back above resistance.
The psychology shifted from:
Expected Trapped Buyers
to
Actual Trapped Sellers
Once sellers became trapped, their exits contributed to the strong upward trend that followed.
The market rewards adaptability and punishes attachment to a prediction.
Even high-quality BOF setups can fail.
The objective is never to predict the future with certainty.
The objective is to consistently execute setups with a positive expectancy.
A stop loss being hit does not mean the setup was wrong.
It means risk management worked exactly as intended.
Small controlled losses are a necessary cost of doing business in the market.
The strongest BOF setups show immediate continuation after rejection.
In EICHERMOT, selling pressure failed to expand after the initial rejection.
This was the first indication that the setup might not succeed.
The stock initially rejected the VRZ.
Later, it accepted prices above the same level.
When the market demonstrates acceptance after rejection, traders must be willing to adjust their bias.
Entry: Short below the VRZ High after BOF confirmation.
Stop Loss: Above the BOF rejection high.
Expected Target: 1:3 Risk-Reward.
Actual Outcome: Stop Loss Hit.
Risk Management Result: Controlled loss with predefined risk.
Most traders focus exclusively on successful setups.
Professional traders analyze both successful and unsuccessful trades.
The purpose of reviewing failed BOF trades is not to find faults in the strategy.
The purpose is to understand market behavior and reinforce disciplined execution.
Long-term trading success does not come from avoiding losses.
It comes from:
A failed BOF does not invalidate the methodology.
It simply reinforces one of the most important realities of trading:
Markets operate on probabilities, not certainties. A well-executed losing trade is often more valuable than a poorly executed winning trade.
.jpeg)
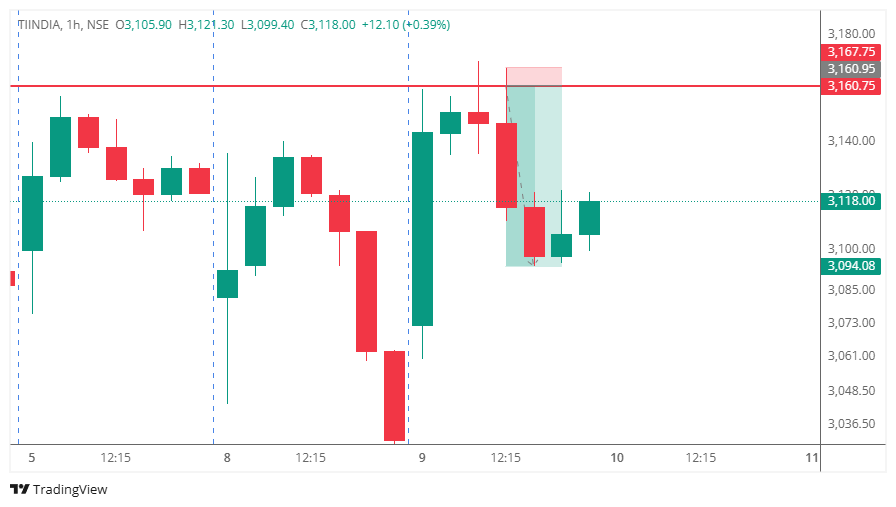
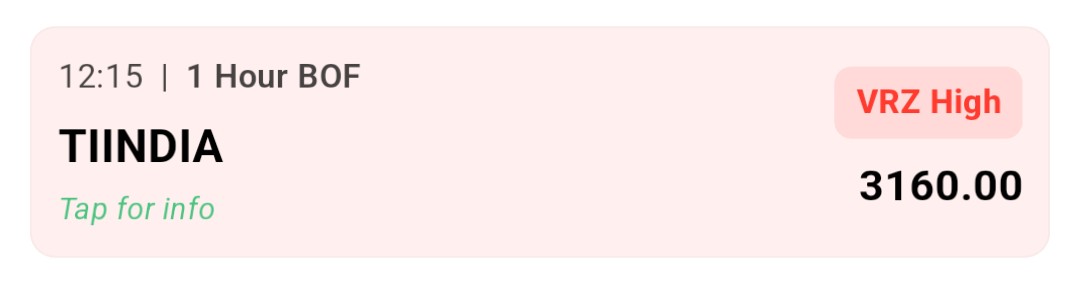
Stock Name: Tube Investments of India Ltd (TIINDIA)
Sector: Engineering & Auto Components
Trade Type: Swing
VRZ Marking Time Frame: Daily
Trading Time Frame: 1 Hour
Setup Type: Breakout Failure (BOF)
Zone: VRZ High – ₹3,160
TIINDIA approached a previously identified Daily Visible Reversal Zone (VRZ) High at ₹3,160 after a strong bullish recovery from lower levels.
The stock successfully moved above the VRZ High, creating the appearance of a convincing bullish breakout. The breakout candle attracted traders expecting a continuation move and a potential expansion toward fresh swing highs.
However, the market failed to accept prices above the VRZ.
Despite initially trading above ₹3,160, follow-through buying was absent. Instead, sellers emerged aggressively near the breakout zone and quickly pushed the stock back below the VRZ resistance.
The breakout lost momentum almost immediately.
As price started trading below the VRZ High, bearish candles developed and the stock witnessed a sharp intraday decline. The inability to sustain above the breakout level confirmed a classic Breakout Failure (BOF) setup.
Once the breakout failed, trapped buyers and late momentum participants began exiting positions, adding fuel to the downside move.
Most traders are conditioned to believe:
Strong breakout above resistance = Buy opportunity.
As TIINDIA crossed above ₹3,160, many market participants experienced:
The market, however, had a different plan.
When price failed to sustain above the VRZ:
Started questioning the strength of the breakout.
Realized momentum was fading rapidly.
Used the breakout liquidity to distribute positions near resistance.
Became forced sellers as the breakout failed.
This shift from optimism to uncertainty created the momentum behind the decline.
The market once again demonstrated that acceptance above resistance matters more than temporarily trading above it.
A breakout candle alone does not validate a bullish trend.
The market must prove that buyers are willing to transact and hold positions above the breakout level.
TIINDIA failed this test.
Many traders focus on the moment price crosses resistance.
Professional traders focus on what happens afterward.
The immediate rejection above ₹3,160.75 revealed that higher prices were not being accepted by the market.
Failed breakouts create an imbalance of expectations.
When buyers become trapped above resistance, their exits often contribute to strong bearish momentum.
This dynamic was clearly visible in the TIINDIA setup.
Higher-timeframe VRZ levels often attract institutional participation.
The strong rejection from the Daily VRZ High reinforced the importance of respecting these decision zones.
Entry: Short position after confirmation that price failed to hold above the Daily VRZ High and moved back below ₹3,160.75.
Stop Loss: Above the BOF high and Daily VRZ resistance.
Outcome: 1 : 6 RR
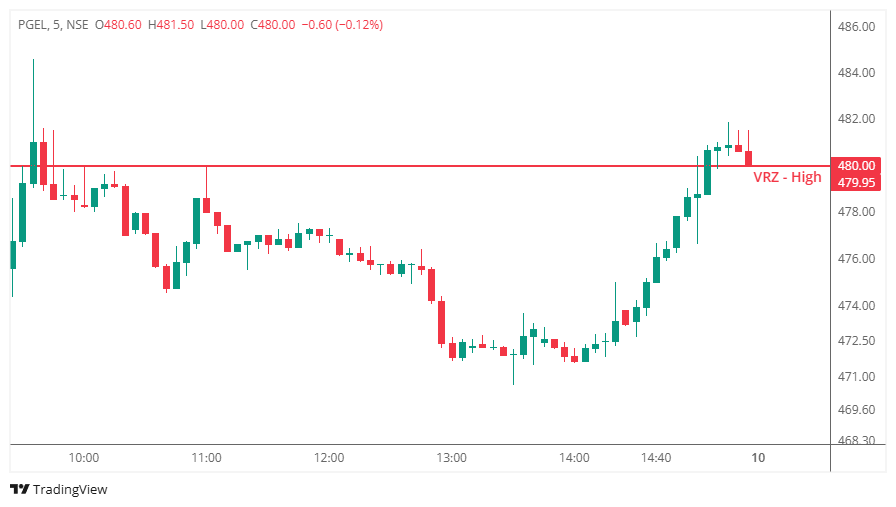
Stock Name: PG Electroplast Ltd (PGEL)
Sector: Consumer Electronics & Manufacturing
Time Frame: 5 Minutes
VRZ Marking: 30 Minutes
Setup Type: Breakout Failure (BOF)
Zone: VRZ High – ₹479.95
PGEL spent a large part of the session trading below the VRZ High at ₹479.95. During the second half of the day, buyers gradually regained control and initiated a strong recovery from the intraday lows.
As momentum increased, the stock rallied sharply toward the resistance zone and eventually broke above the VRZ High. The breakout looked convincing, supported by a series of strong bullish candles and improving market sentiment.
The move above ₹479.95 attracted breakout traders expecting a continuation toward higher levels.
However, the market failed to sustain above the breakout zone.
After briefly trading above the VRZ, buying momentum began to slow. The stock struggled to build acceptance at higher prices and sellers emerged near the day's highs. Subsequent candles showed rejection from the breakout area and price slipped back below the VRZ High.
This loss of acceptance confirmed a Breakout Failure (BOF) setup.
Although the downside move was not as aggressive as some BOF structures, the rejection still provided a clean risk-defined short opportunity and generated a measurable intraday reward.
One of the most common trading mistakes is confusing momentum with confirmation.
As PGEL rallied strongly during the afternoon session, many traders believed:
The market delivered a different outcome.
The breakout generated excitement, but not commitment.
When price started slipping back below ₹479.95:
This shift in sentiment transformed bullish enthusiasm into caution, creating the BOF opportunity.
The market once again demonstrated that participation above resistance is less important than acceptance above resistance.
PGEL showed impressive strength during the afternoon rally.
However, a strong approach to resistance does not automatically translate into a successful breakout. The market must still prove acceptance above the level.
The area around ₹479.95 became the key decision point for the session.
The inability to sustain above this zone revealed the presence of active sellers despite the bullish recovery.
The breakout itself was not the signal.
The real information came from what happened after the breakout. When price failed to hold above the VRZ, the probability shifted in favor of a BOF setup.
Not every BOF produces a large trend move.
Even when the downside move is moderate, maintaining disciplined entries and stops allows traders to extract favorable risk-reward outcomes.
Entry: Short position after confirmation that price moved back below and failed to reclaim the VRZ High (₹479.95)
Stop Loss: Above the breakout rejection candle high
Target: 1:3 RR (Fixed)
Outcome: Approximately 1:2 RR
.jpeg)