Select a trading day to view all Scanner results, chart evidence, and market explanations.
4 Scanners Available
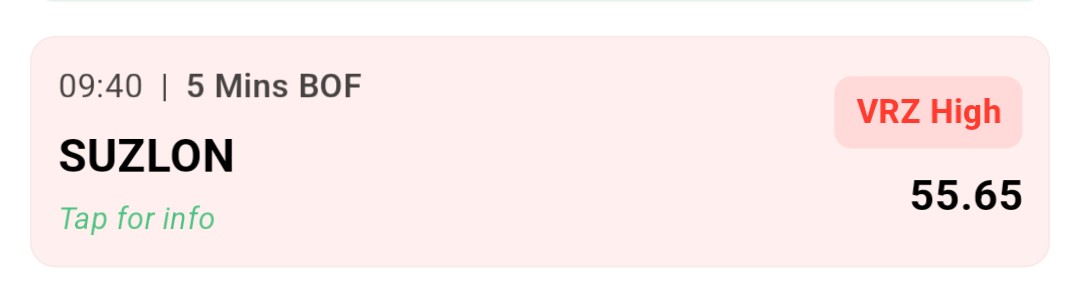
Stock Name: Suzlon Energy Ltd (SUZLON)
Sector: Renewable Energy / Wind Energy
Trade Type: Intraday
VRZ Marking Time Frame: Daily
Trading Time Frame: 5 Minutes
Setup Type: Breakout Failure (BOF)
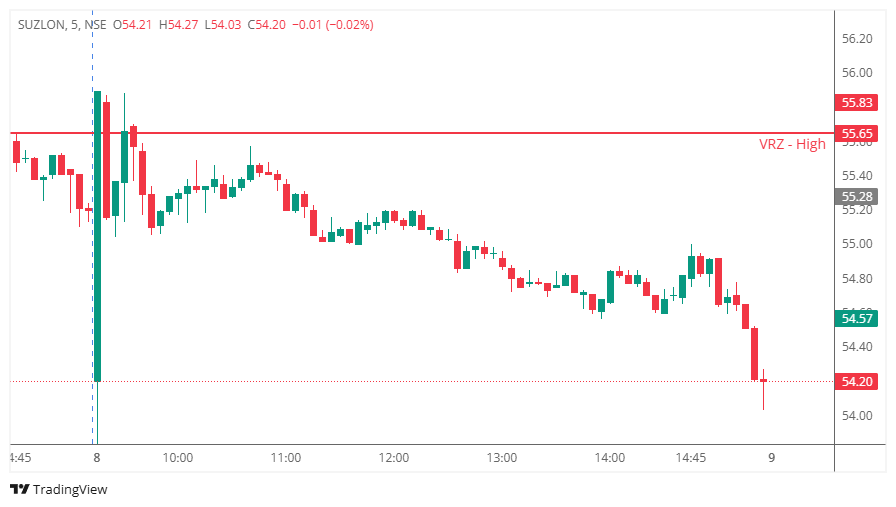
Zone: VRZ High (₹55.65)
SUZLON approached a previously identified Visible Reversal Zone (VRZ) High at ₹55.65.
At the market open, price aggressively moved above the VRZ High, creating the appearance of a strong bullish breakout. The initial momentum likely attracted breakout traders expecting continuation toward higher levels.
However, the breakout failed to gain acceptance.
Although price briefly traded above the resistance zone, buyers were unable to sustain the move. Selling pressure quickly emerged and pushed price back below the VRZ High.
Once the market returned below resistance, bullish momentum disappeared. The stock then spent the remainder of the session making lower highs and lower lows.
The inability to hold above ₹55.65 confirmed a Breakout Failure (BOF).
As trapped breakout buyers exited their positions, downside pressure increased and resulted in a steady decline throughout the day.
Most market participants are conditioned to think:
Resistance Breaks → Buy the Breakout
When SUZLON traded above ₹55.65, many traders experienced:
Unfortunately, the market had different plans.
When price moved back below the breakout level:
Began questioning the validity of the move.
Found themselves trapped near the highs.
Used breakout liquidity to distribute positions.
Became forced sellers as price continued falling.
The transition from bullish confidence to uncertainty created the fuel for the intraday decline.
Strong opening candles can create excitement, but they do not guarantee continuation.
The market must prove it can sustain above the breakout level.
Many traders focus on whether price crossed resistance.
Professional traders focus on whether price remains above resistance.
SUZLON failed this acceptance test.
When breakout traders become trapped, their exits can accelerate movement in the opposite direction.
This creates some of the highest-quality BOF opportunities.
Even on a 5-minute chart, major Daily VRZ zones remain highly significant.
The reaction around ₹55.65 highlighted the importance of the level.
Entry: Short position after confirmation that price failed to hold above the VRZ High.
Stop Loss: Above the BOF high and VRZ resistance.
Target: 1:7 Risk-Reward (RR)
Outcome: Strong bearish follow-through after the BOF confirmation, successfully achieving the planned 1:7 RR objective.

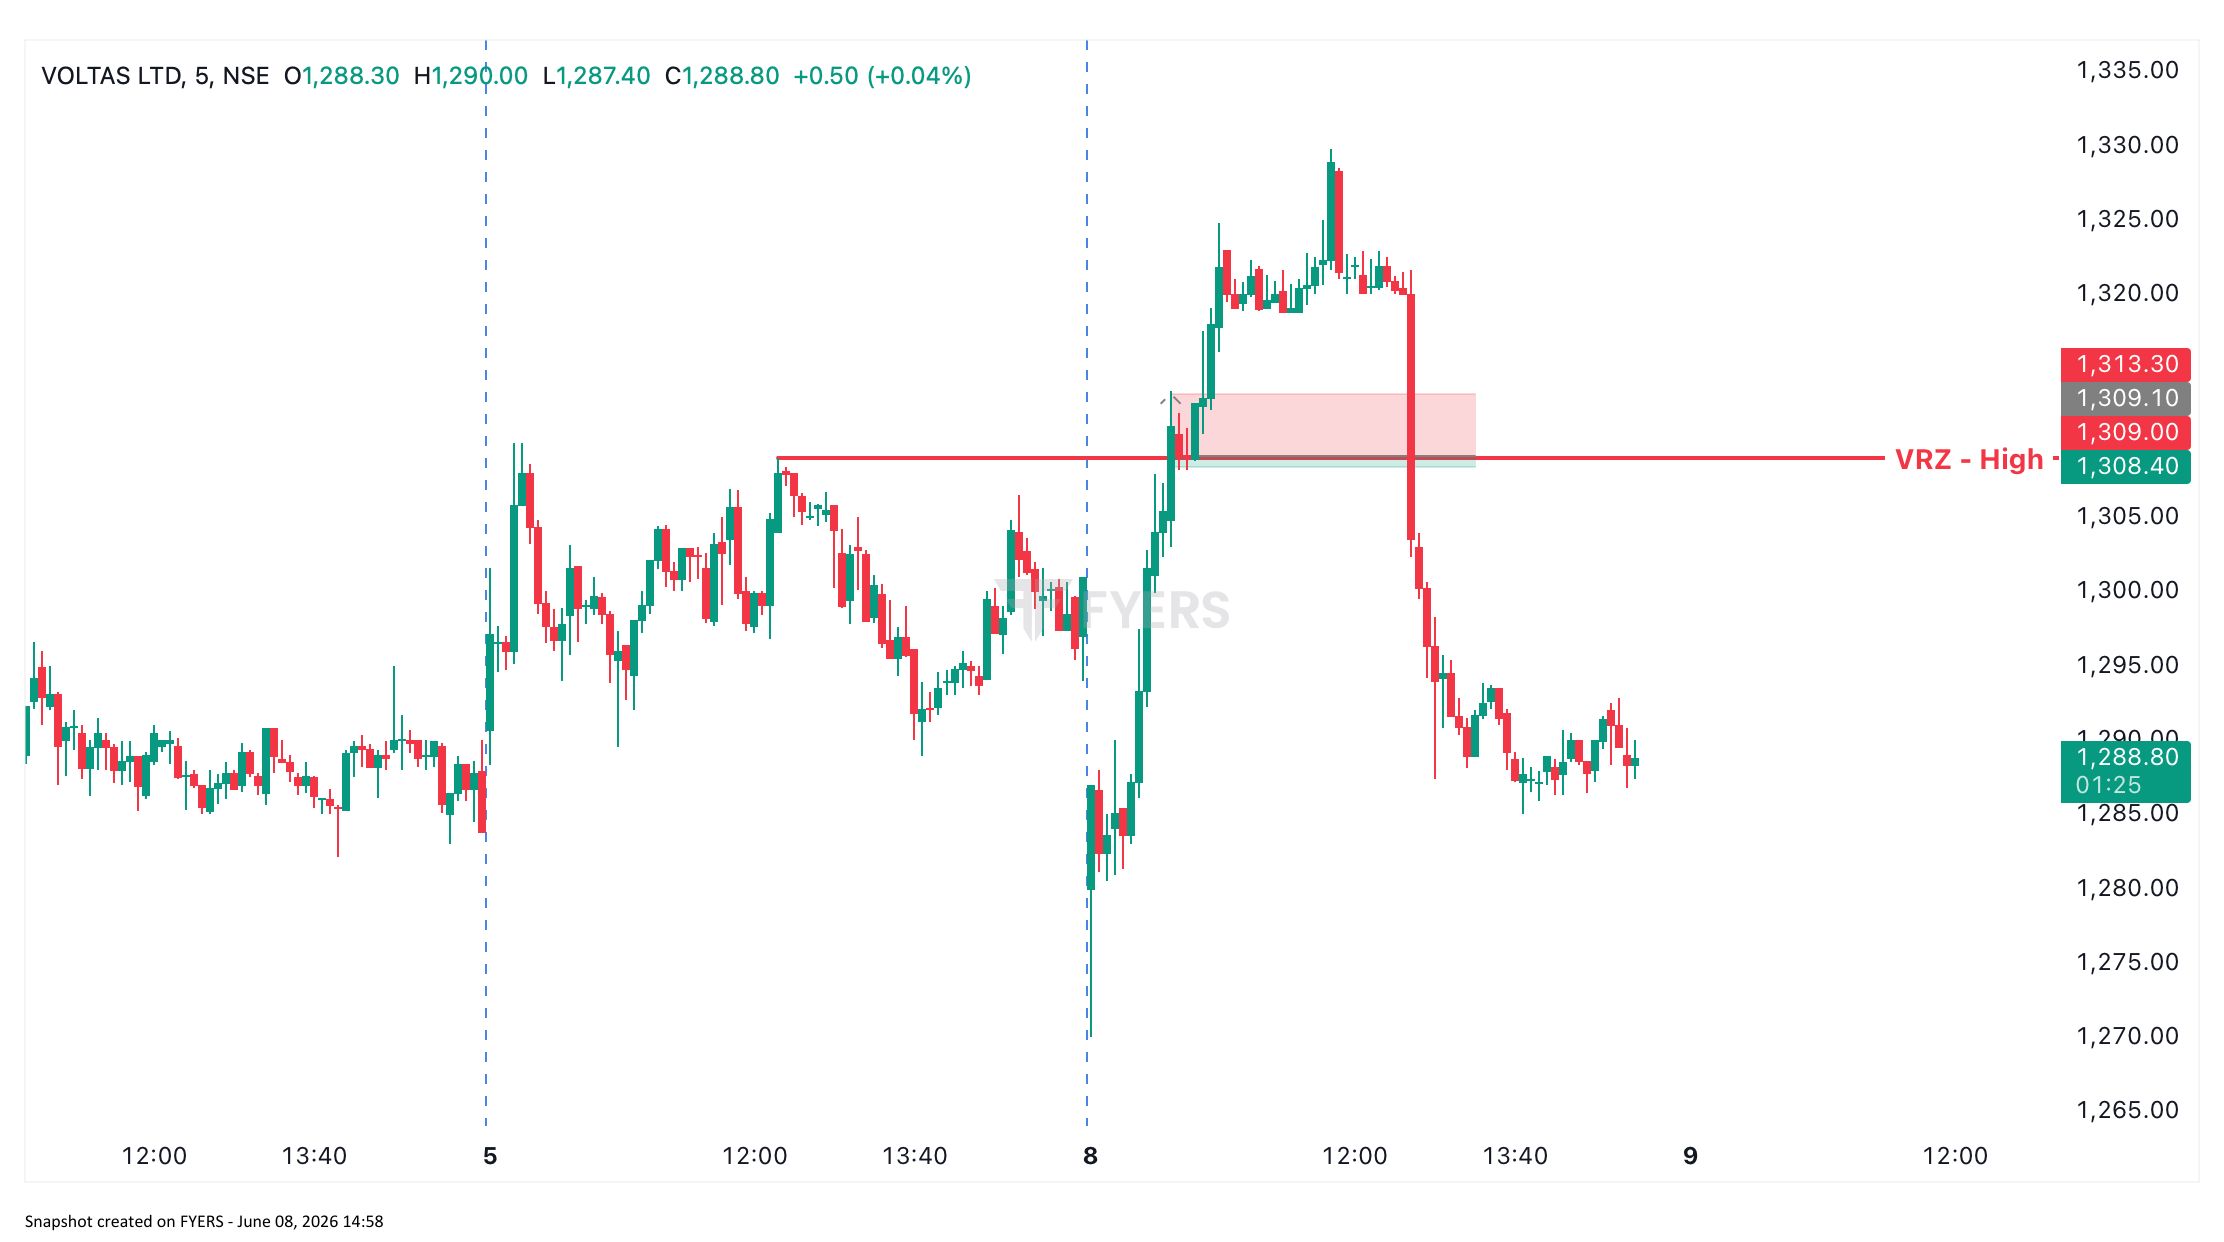
Voltas approached a significant VRZ High near ₹1308.40.
After initially breaking above the resistance level, price moved back below the VRZ, creating a potential bearish BOF setup.
Under BOF rules, this suggested that breakout buyers could be trapped and that a downside move might follow.
The short trade was initiated after the rejection below the VRZ.
However, the market quickly invalidated the setup.
Instead of accelerating downward, buyers stepped back into the market and pushed price higher, resulting in a stop loss.
Most traders believe losses occur because the analysis was wrong.
In reality, losses occur because probabilities are never 100%.
The BOF setup was valid.
The execution was valid.
The risk management was valid.
The outcome simply did not favor the trade.
This is an important distinction.
A losing trade does not automatically mean a bad trade.
After the BOF trigger, sellers failed to create strong downside momentum.
Without follow-through, BOF setups become vulnerable.
Buyers quickly absorbed the selling pressure and regained control.
Although some breakout traders were trapped, there were not enough participants exiting positions to fuel a larger decline.
Markets are auction mechanisms.
Sometimes the market simply decides to continue higher despite a valid setup.
Many beginners judge a setup based on the outcome.
Professionals judge a setup based on execution quality.
This Voltas trade was a good setup that produced a bad outcome.
The stop loss was small and predefined.
This allows traders to survive failed trades and participate in future winners.
If a strategy wins 55-60% of the time with strong risk-reward ratios, losses are expected and necessary.
One failed trade does not invalidate the edge.
Stock: Voltas Ltd
Sector: Consumer Durables
Timeframe: 5 Minutes
Setup: Bearish BOF at VRZ High
VRZ High: ₹1308.40
Entry: After rejection below VRZ
Stop Loss: Above BOF high
Outcome: Stop Loss Hit
Result: Failed BOF

State Bank of India - SBI Breakout Failure Analysis: How a BOF at VRZ Low Generated a 3R Intraday Opportunity
Stock Name: State Bank of India (SBIN)
SectorBanking & Financial Services
Time Frame: 5 Minutes
Setup Type: Bullish BOF at VRZ Low
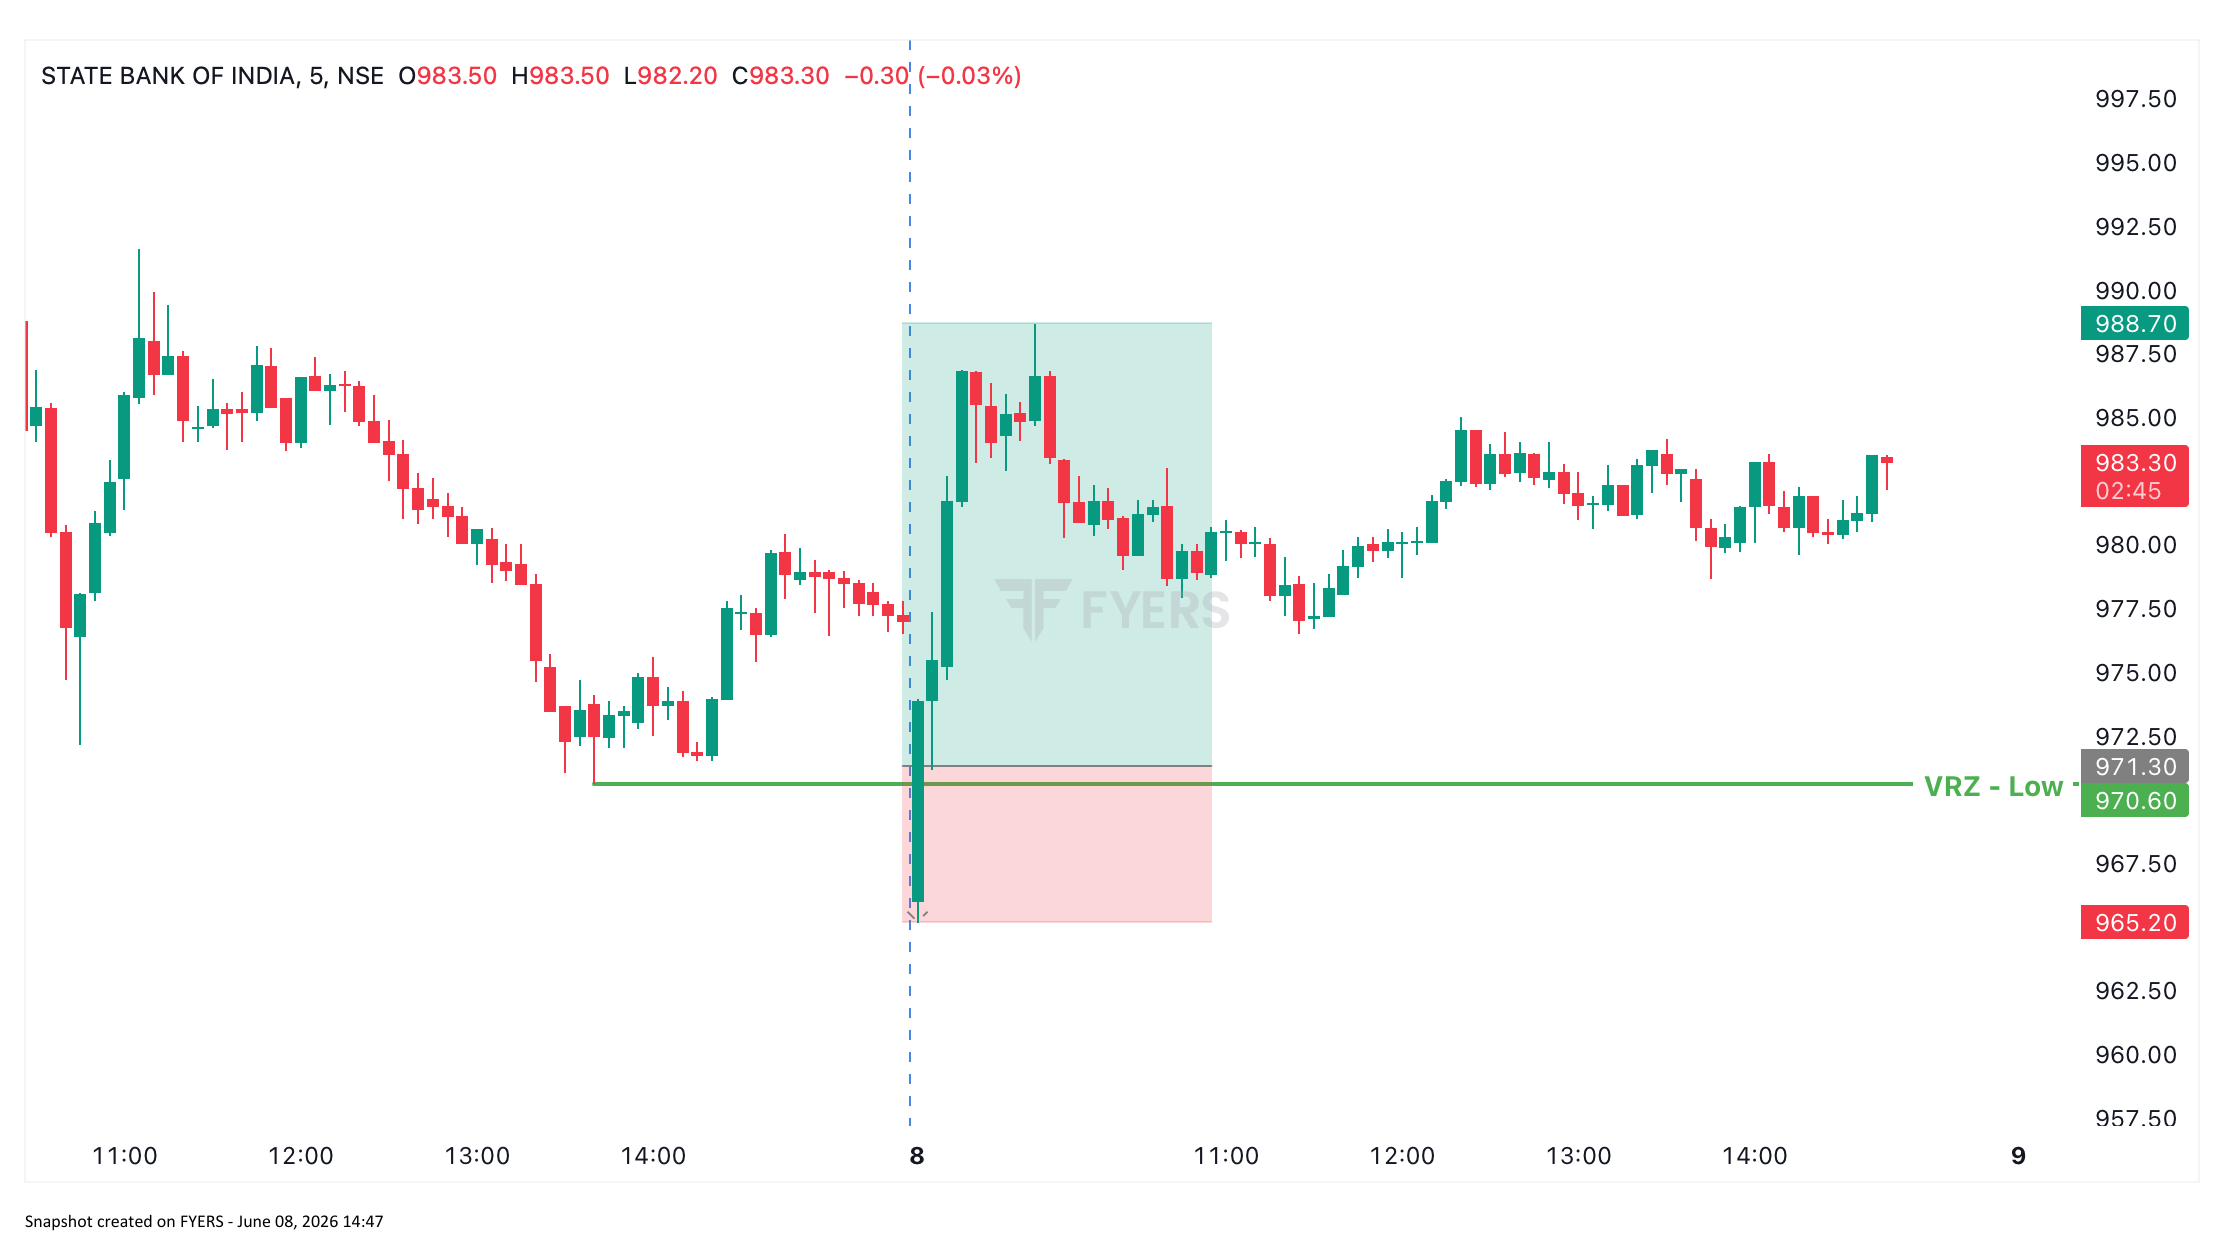
State Bank of India approached a key VRZ Low at ₹970.60 after a period of weakness in the previous session.
At market open, price briefly broke below the VRZ and touched a low near ₹965.20. For many traders, this appeared to be a genuine support breakdown and the beginning of a bearish continuation move.
However, the market quickly rejected lower prices.
Within a few candles, SBIN reclaimed the VRZ and moved back above support. This reclaim signaled that sellers were unable to maintain control below the breakdown level.
Once the failed breakdown was confirmed, buyers stepped in aggressively, pushing the stock higher and creating a trade that delivered approximately 3 times the initial risk (3R).
The best BOF setups often begin when the majority of traders feel confident about the wrong direction.
When SBIN moved below ₹970.60:
The breakdown looked convincing.
But markets are driven by acceptance, not penetration.
The moment price reclaimed the VRZ, the psychology shifted.
Became future buyers as stop losses started triggering.
Recognized the reclaim and joined the move.
Shifted from bearish expectation to bullish reality.
The rally that followed was fueled by both buying interest and short-covering activity.
The market spent very little time below the VRZ, indicating that lower prices were not accepted.
Fast reclaim after a breakdown often signals aggressive institutional participation.
The stop loss remained tight below the BOF low while the upside potential remained substantial.
The setup created a textbook seller trap, one of the strongest ingredients in a BOF trade.
A breakdown becomes meaningful only when the market accepts lower prices.
SBIN failed to do that.
Many traders focus on the breakdown candle.
Experienced traders focus on the reclaim.
The setup offered a small predefined risk and a large potential reward, making it attractive regardless of the outcome.
Some of the strongest intraday moves begin when one side of the market is forced to exit.
Long after price reclaimed the VRZ Low at ₹970.60.
Below BOF Low.
1:3 RR (Fixed)

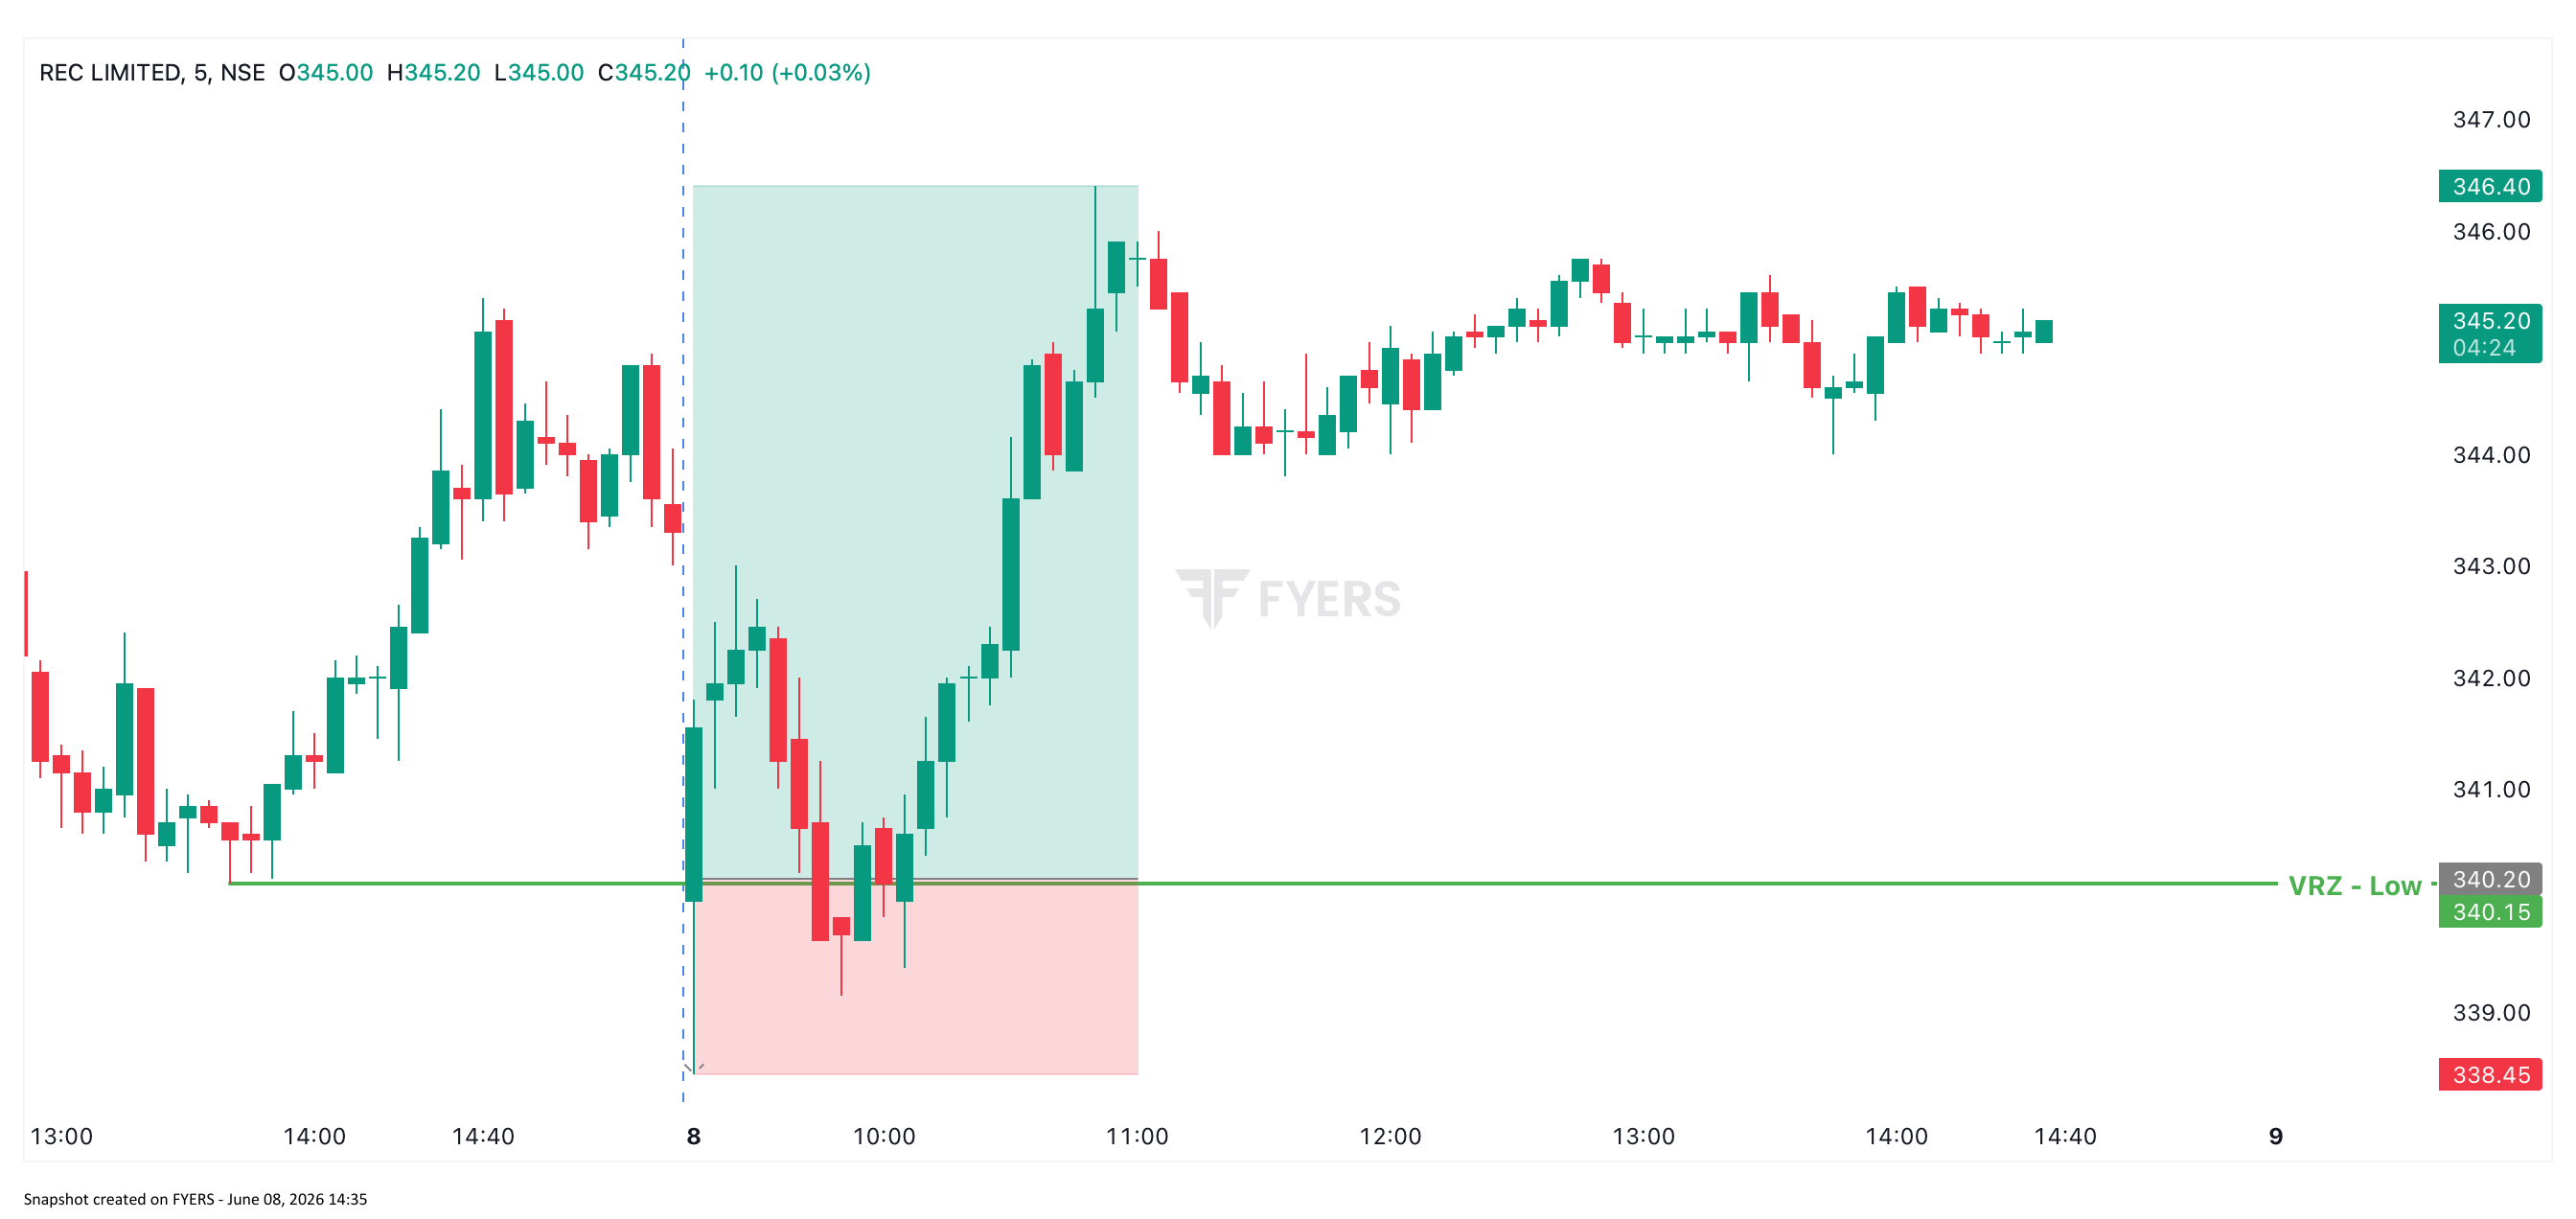
Stock Name: REC Limited
Sector: Finance
Time Frame: 5 Minutes
Setup Type: Bullish BOF at VRZ Low
REC approached a previously identified VRZ Low at ₹340.15, a level where buyers had historically shown interest.
During the morning session, the stock briefly broke below the VRZ, creating the impression that support had failed.
For many traders, this looked like the beginning of a bearish continuation move.
However, the breakdown failed.
Instead of accepting lower prices, the market quickly reclaimed the support zone. The recovery above the VRZ indicated that sellers were unable to maintain control below the breakdown level.
Once the reclaim was confirmed, buyers stepped in aggressively and price rallied throughout the session.
At the time of this analysis, the trade has already delivered approximately 3.5 times the initial risk (3.5R) while maintaining bullish structure.
Most traders are taught a simple rule:
Support breaks → Sell.
The problem is that markets are rarely that simple.
When REC traded below ₹340.15:
The market absorbed all that selling pressure.
As price reclaimed the VRZ:
The rally was fueled not only by buying but also by short-covering from trapped sellers.
This is why failed breakdowns often create explosive moves.
The VRZ acted as a decision-making zone where buyers were willing to defend the price.
The market did not spend much time below support.
Fast rejection often signals strong institutional participation.
The stop loss remained small because it was placed below the BOF low.
Once the market accepted prices above ₹340.15, momentum expanded rapidly in favor of buyers.
A price move below support is merely information.
The market still needs to prove acceptance below that level.
The reclaim often provides more information than the breakdown itself.
This is where many high-probability BOF trades originate.
REC offered a tight stop loss and significant upside potential.
That combination created a favorable risk-reward profile from the start.
Every strong BOF move starts with someone trapped on the wrong side.
Understanding that psychology can provide a significant trading edge.
Long after price reclaimed the VRZ Low at ₹340.15.
Below BOF Low.
Approximately 3.5R
