Select a trading day to view all Scanner results, chart evidence, and market explanations.
2 Scanners Available
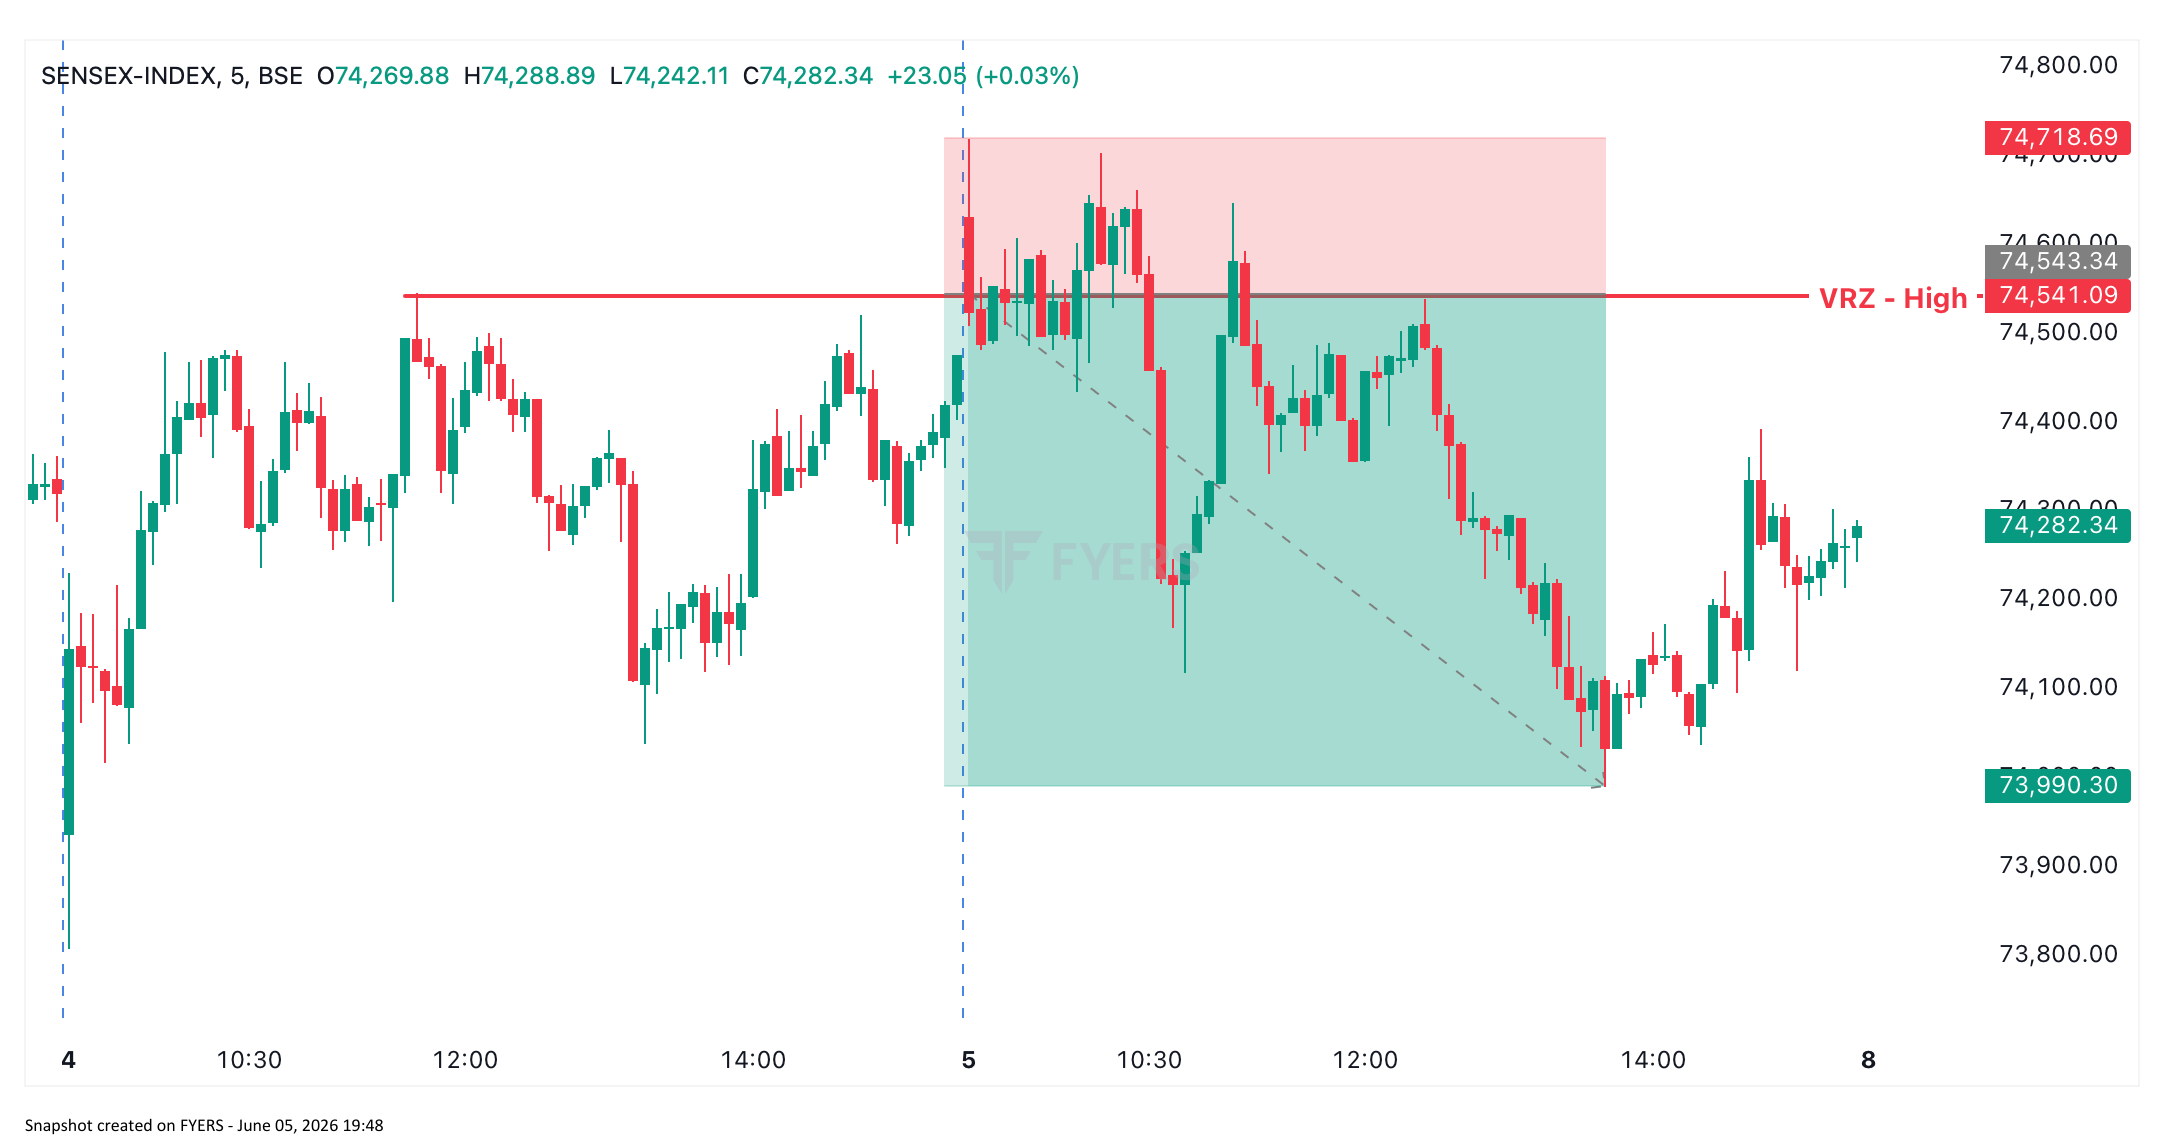
A textbook BOF Short setup formed on the Sensex 5-minute chart when price failed to sustain above a key VRZ High resistance zone. The failed breakout trapped buyers and resulted in a clean 1:3 Risk-Reward opportunity.
Instrument: Sensex Index
Timeframe: 5 Minutes
Setup: BOF Short
Zone: VRZ High Resistance
Price approached the previously marked VRZ High resistance zone around 74,541.
The breakout initially appeared strong.
Many traders interpreted the move as the beginning of a bullish continuation.
Price managed to move above resistance and encouraged breakout buyers to enter aggressively.
However, the market failed to sustain above the VRZ High.
The breakout lost momentum quickly and sellers regained control.
Once price moved back below the resistance zone, the breakout officially failed and generated a BOF Short opportunity.
The subsequent decline confirmed the weakness of the breakout and rewarded traders who recognized the trap.
The trade was driven by expectation versus reality.
When a breakout fails, buyers who entered late often become forced sellers.
That selling pressure accelerates the move in the opposite direction.
The market punishes certainty and rewards observation.

BOF confirmation below VRZ High
Above BOF High
1:3 RR (Fixed)
A breakout is not confirmed because price crosses a level.
A breakout is confirmed only when price can remain above that level.
Many traders focus on the breakout candle.
Experienced traders focus on what happens after the breakout.
The failure itself often provides the highest-quality information.
Most traders lose money by chasing breakouts.
BOF traders wait for evidence that the crowd is wrong.
This trade demonstrates a core principle of the Logical Trading System (LTS):
The best opportunities often come from failed expectations, not fulfilled expectations.
Instrument: Sensex Index
Timeframe: 5 Minutes
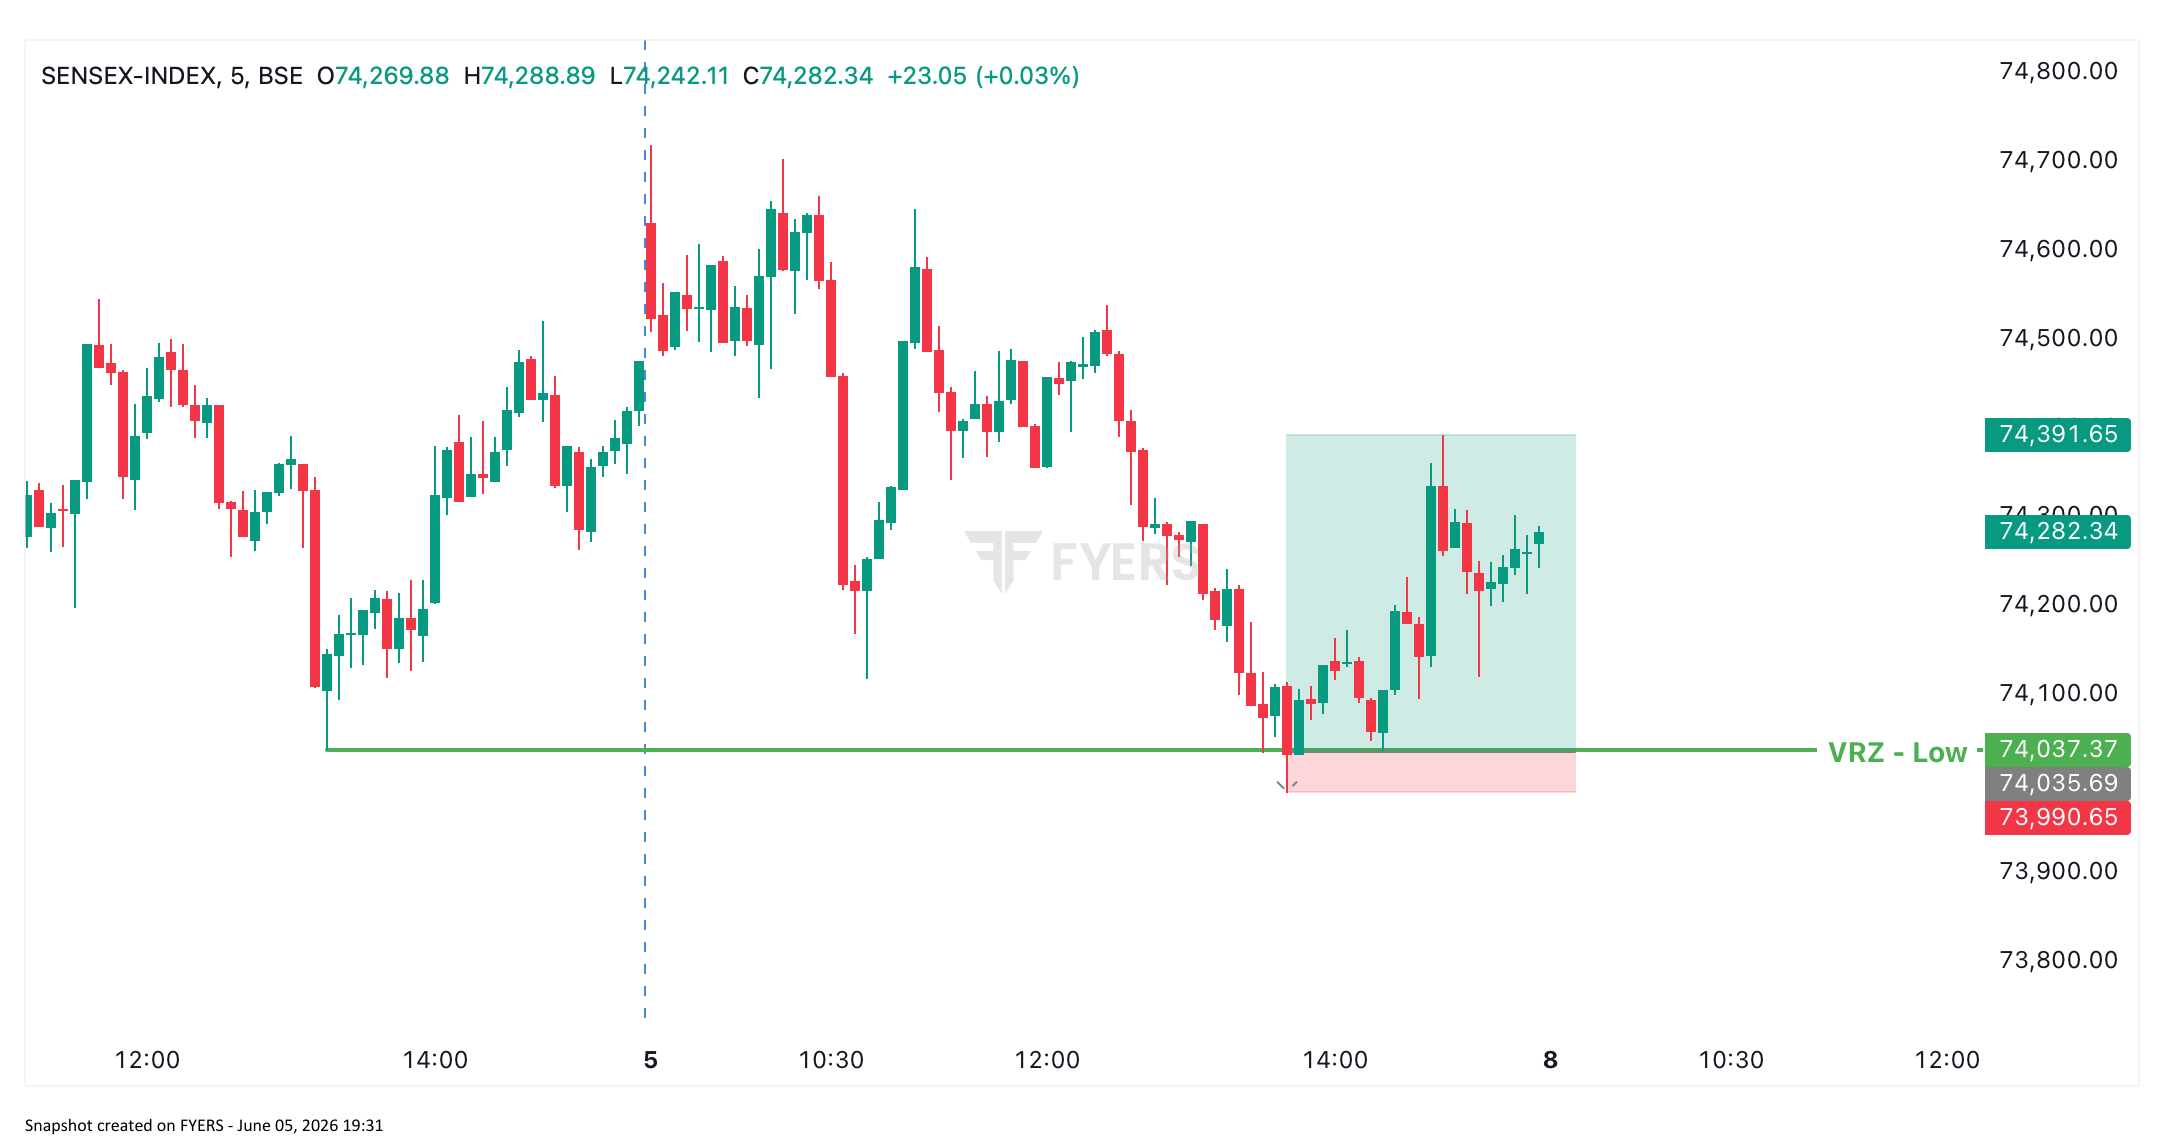
Setup: BOF Long
Location: VRZ Low
Price was in a short-term downtrend and eventually broke below the previously identified VRZ Low zone around 74,037.
At first glance, the breakdown appeared convincing.
Many traders interpreted the move as a continuation of bearish momentum.
However, the market quickly rejected lower prices.
Instead of sustaining below support, buyers absorbed the selling pressure and pushed price back above the VRZ level.
This created a classic Breakout Failure (BOF).
The failed breakdown trapped short sellers while attracting fresh buyers.
Once price reclaimed the VRZ zone, the probability shifted in favor of the upside.
The most interesting part of this trade is not the price movement.
It is the emotion behind it.
The fuel for the rally was not buying alone.
It was trapped sellers exiting their positions.
Markets often move sharply when a crowd realizes it is on the wrong side.

BOF Confirmation above VRZ Low
Below BOF Low
Approximately 45 Points
Approximately 355 Points
1 : 7
Most traders focus on breakouts.
Few traders study failed breakouts.
A failed breakout often contains more information than a successful breakout because it reveals where the crowd was wrong.
Instead of asking:
"Where is the breakout?"
Ask:
"What happens if this breakout fails?"
That single question can completely change a trader's perspective.
Research and market observation consistently show that a significant percentage of breakouts fail.
The challenge is identifying them in real time.
BOF Scanner is designed to detect these opportunities and alert traders before the crowd realizes the breakout has failed.