Select a trading day to view all Scanner results, chart evidence, and market explanations.
2 Scanners Available
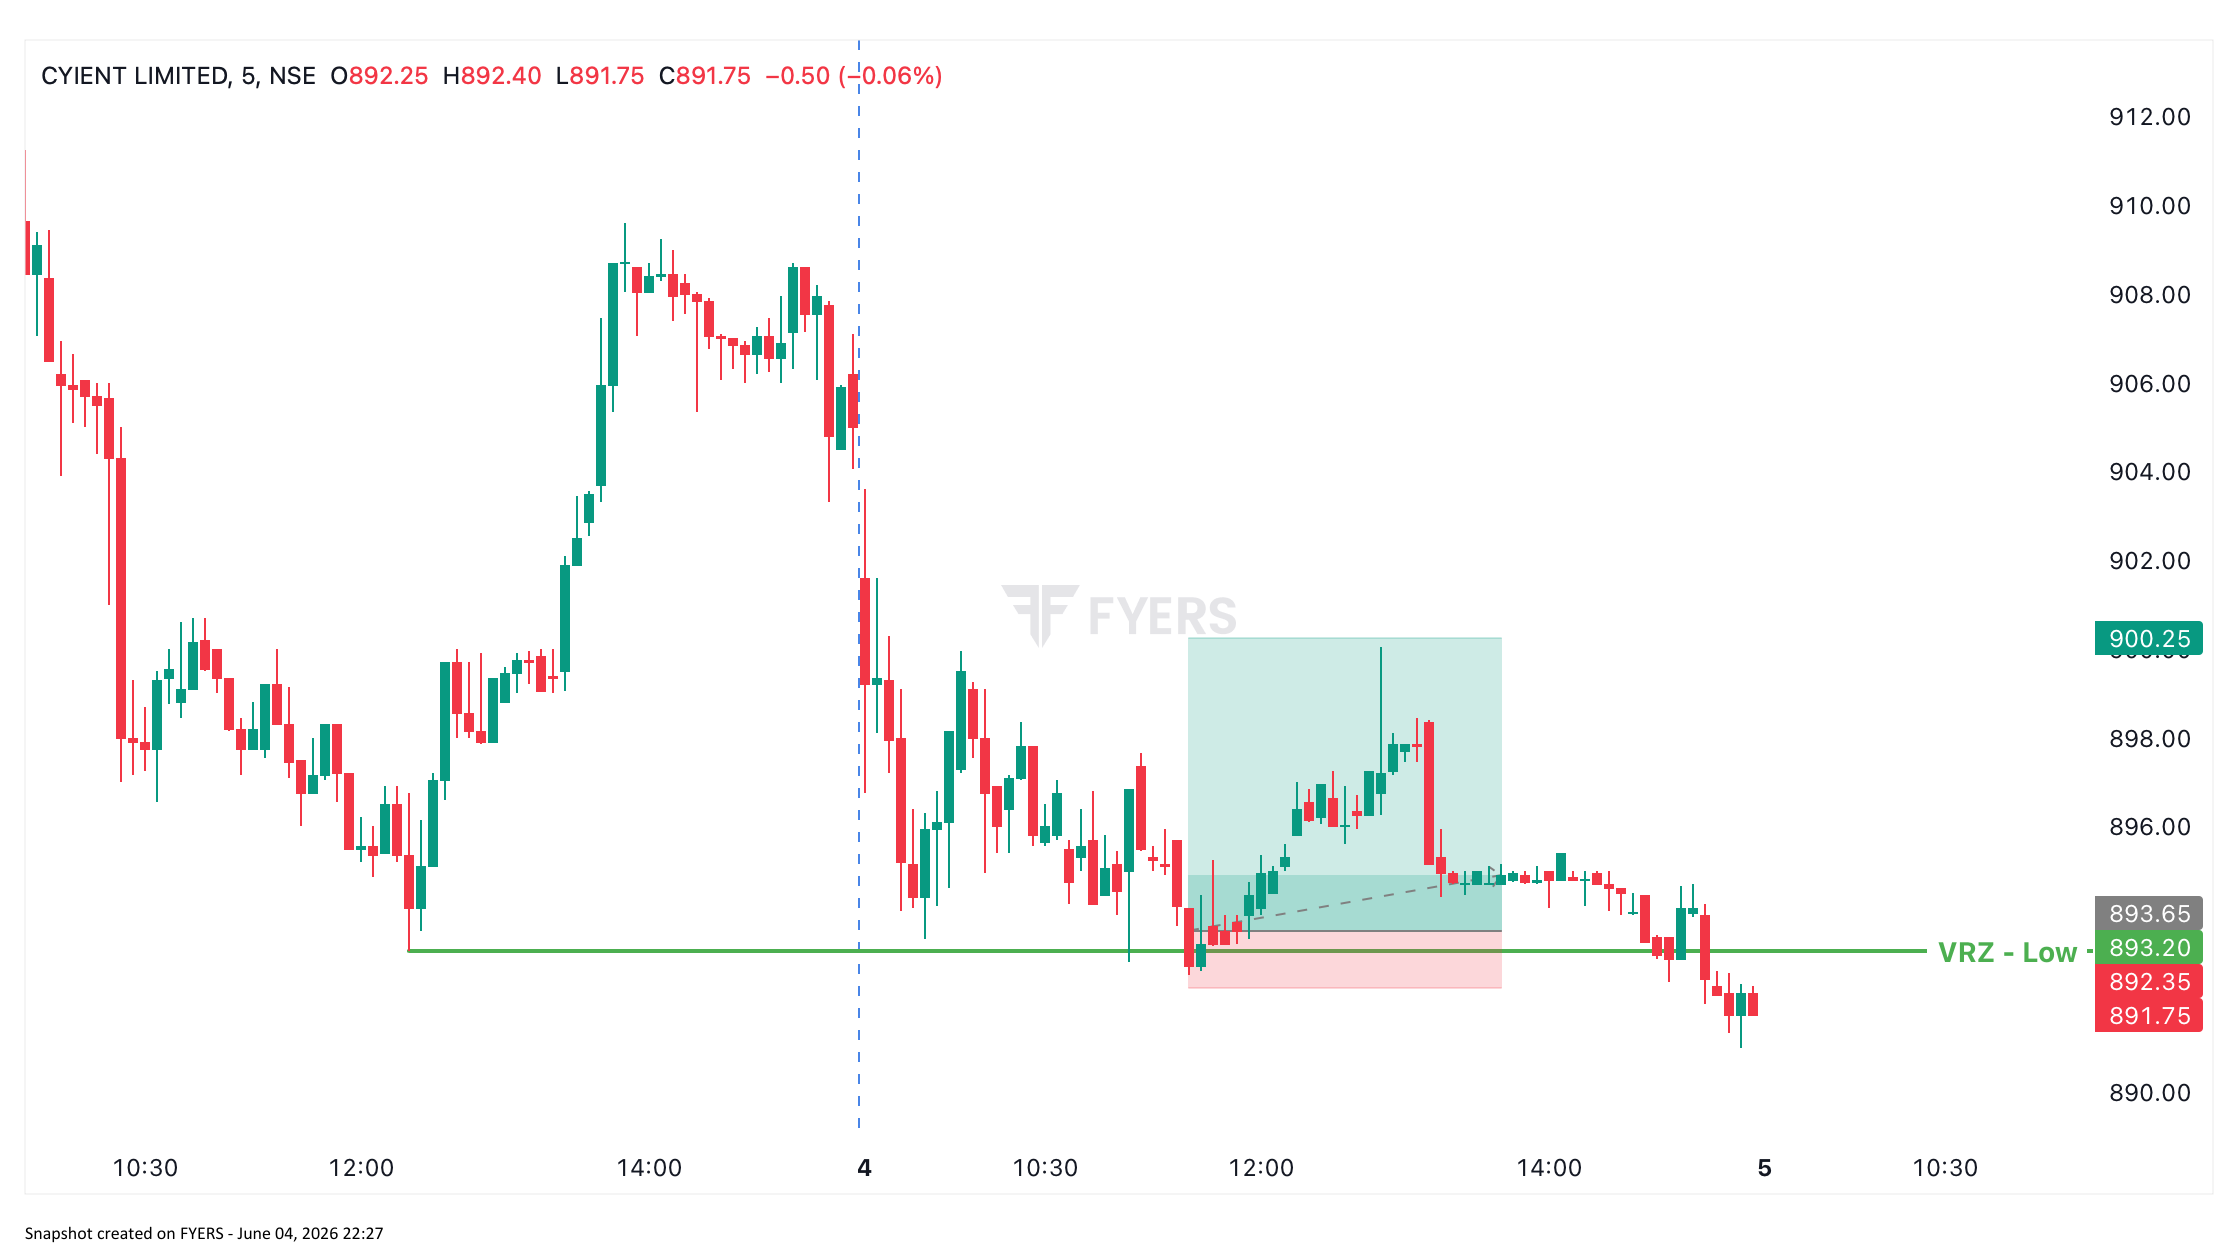
CYIENT approached a previously identified VRZ Low at ₹893.20 after a sharp intraday decline.
As price tested the support zone, many traders expected a breakdown and continuation of the bearish move. The stock briefly traded below the VRZ, triggering fresh short positions and stop losses from existing buyers.
At that moment, the chart appeared weak.
However, the breakdown failed.
Price quickly reclaimed the VRZ and started holding above support. This reclaim indicated that sellers were unable to maintain control below the breakdown level.
Once acceptance above the VRZ was established, buyers entered aggressively and the stock rallied toward ₹900, delivering an impressive 1:5 Risk-Reward opportunity.
Most traders react to what they see.
Professional traders observe what the market fails to achieve.
In CYIENT:
The moment price moved back above ₹893.20, short sellers found themselves trapped.
Their stop-loss exits became buying pressure.
Combined with fresh long positions, this created the fuel for the rally.
This is why some of the strongest intraday moves begin with a failed breakdown.
The market quickly recovered the lost support level, showing that buyers were defending the zone aggressively.
The breakdown invited sellers into the market.
Once the breakdown failed, those sellers became future buyers.
The stop loss remained small because it was placed below the BOF low.
This allowed traders to target a significantly larger reward.
Many BOF setups fail because price cannot sustain the reclaim.
CYIENT successfully accepted prices above the VRZ and continued trending upward.
A trader risking ₹1 had the opportunity to make ₹5.
A breakdown below support is not automatically bearish.
The real question is:
Can price stay below support?
When the market fails in one direction, it frequently accelerates in the opposite direction.
Even if a trader wins only a portion of such setups, a 1:5 Risk-Reward structure can create strong long-term expectancy.
The reclaim of a major VRZ often reveals where institutional buyers are active.
The challenge for most traders is not understanding BOF.
The challenge is finding BOF setups across hundreds of stocks before the move happens.
BOF Scanner continuously monitors stocks approaching key VRZ levels and highlights potential Breakout Failure opportunities where:
✓ Buyers may be trapped
✓ Sellers may be trapped
✓ Risk is clearly defined
✓ Reward potential is favorable
Instead of chasing random breakouts, traders can focus on setups where market psychology provides a measurable edge.

CYIENT delivered a perfect example of why Breakout Failure trading focuses on market behavior rather than prediction.
The breakdown below ₹893.20 attracted sellers.
The failure of that breakdown created the opportunity.
What appeared bearish at first transformed into one of the cleanest bullish BOF setups of the session, ultimately generating a 1:5 Risk-Reward trade for disciplined traders who waited for confirmation.
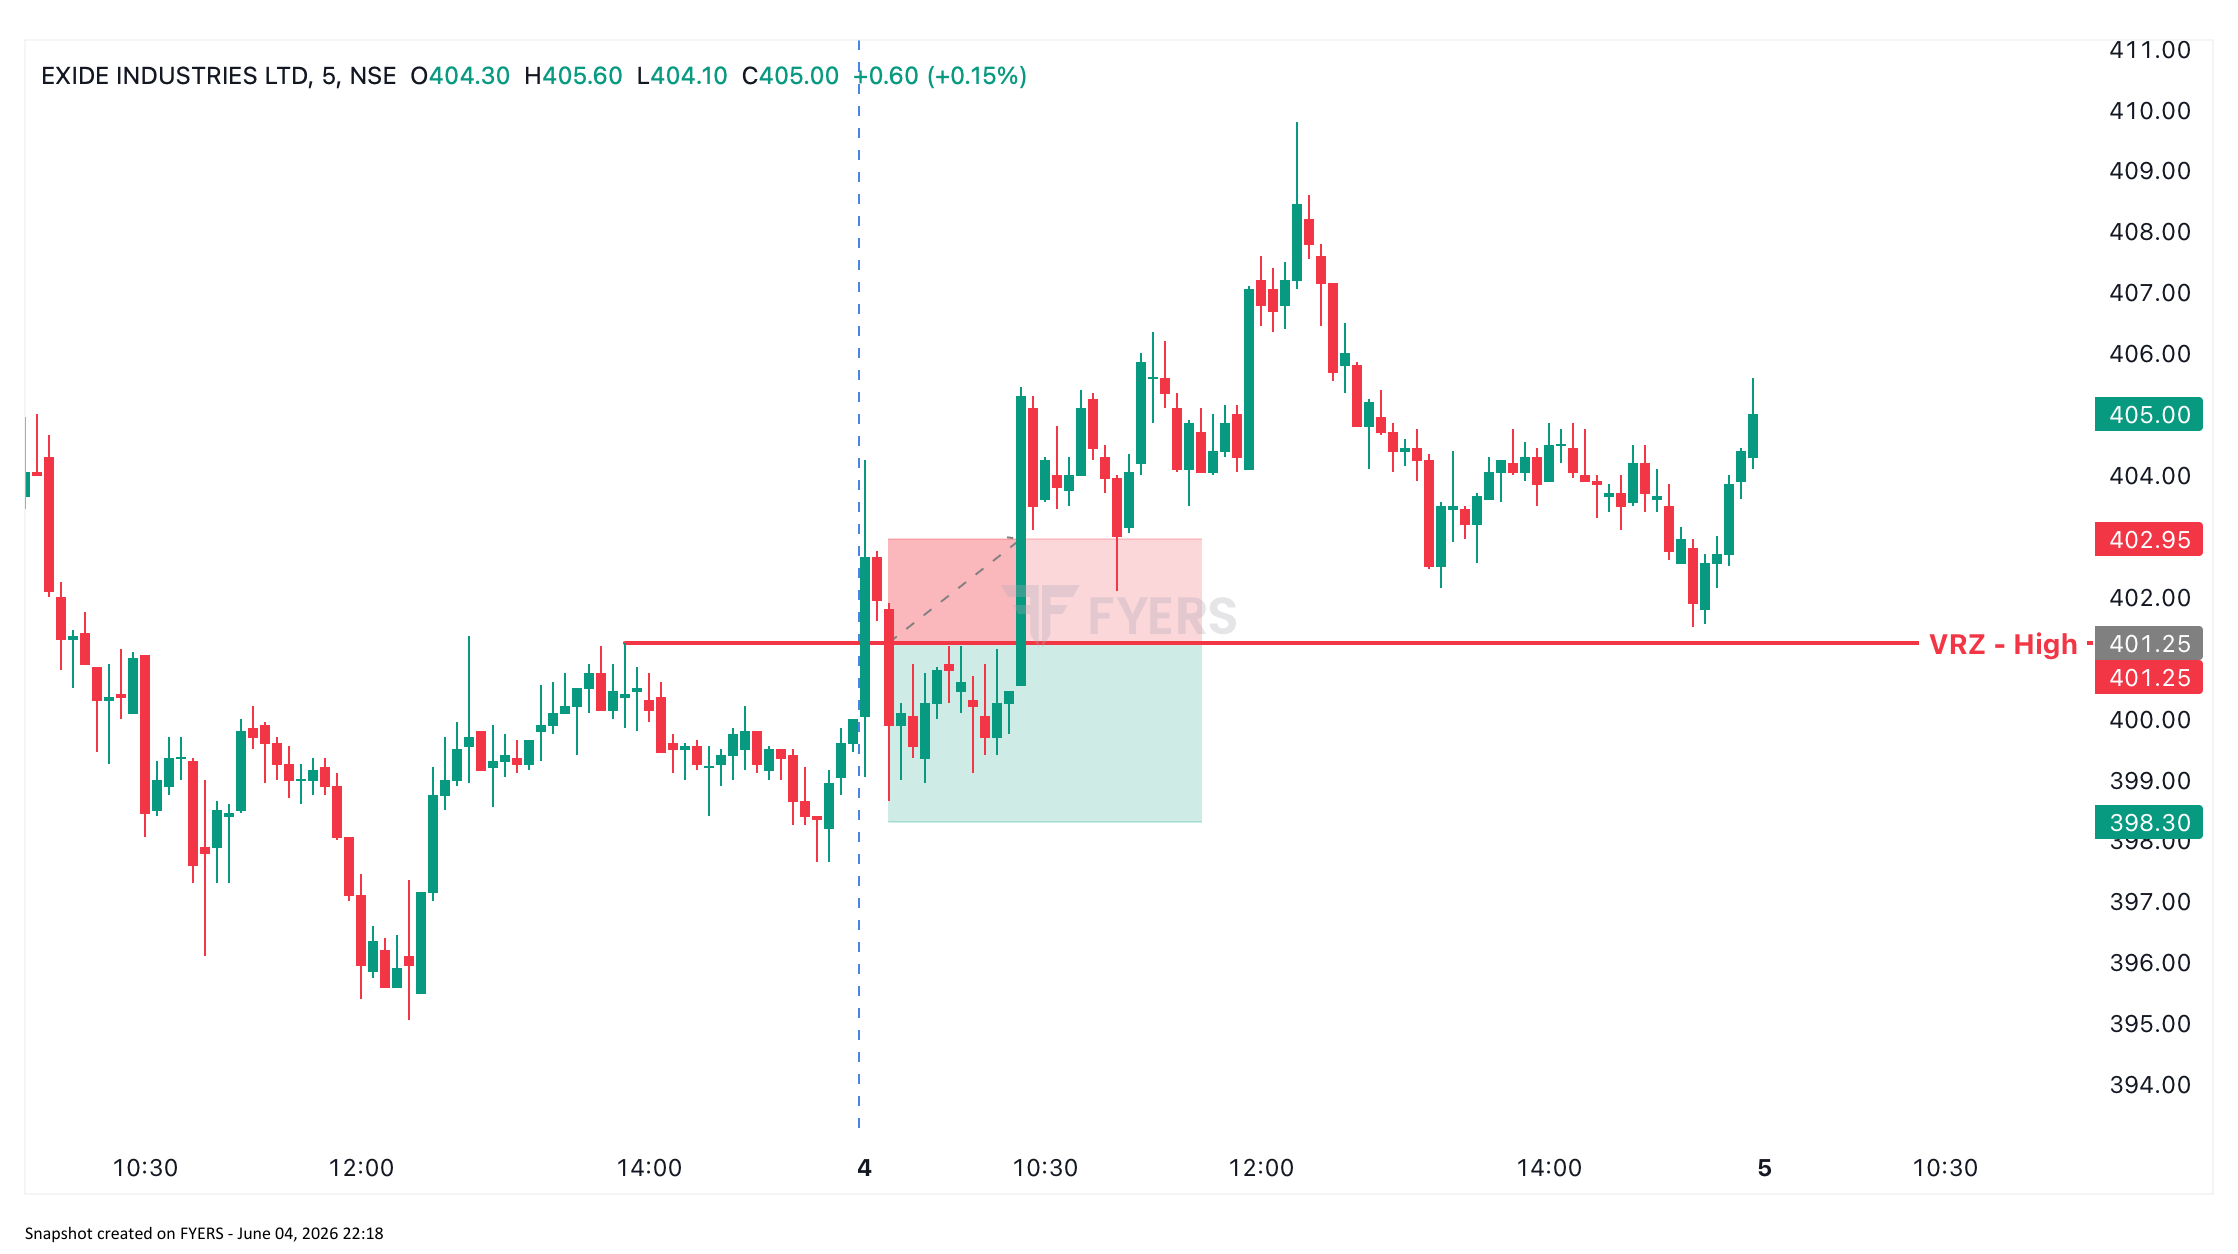
EXIDE approached a previously identified VRZ High at ₹401.25 and initially showed signs of a classic Breakout Failure.
Price moved above the resistance zone but quickly returned below it, creating the appearance of a failed breakout.
Based on BOF principles, this suggested:
The setup provided a valid BOF entry with clearly defined risk.
However, the market had different intentions.
After a brief decline, buyers regained control and pushed the stock higher, eventually triggering the stop loss.
The setup itself was not wrong.
The outcome was different.
Many traders confuse these two concepts.
A good trade setup can still result in a loss.
In EXIDE:
✓ Breakout occurred.
✓ Rejection occurred.
✓ BOF signal appeared.
✓ Risk was defined.
✗ Follow-through selling never arrived.
✗ Buyers absorbed the selling pressure.
✗ Market reclaimed higher prices.
As a result, the BOF failed.
The most dangerous mindset in trading is believing:
"This setup must work."
Professional traders think differently:
"This setup has a probability of working."
When EXIDE moved back below the VRZ, sellers gained confidence.
Many expected trapped buyers to create downside momentum.
Instead:
The psychology shifted from:
Trapped Buyers → Expected
to
Trapped Sellers → Reality
The market continuously rewards flexibility and punishes certainty.
Even high-quality BOF setups can fail.
Success comes from managing risk, not predicting outcomes.
The stop loss is not evidence that the setup was wrong.
It is evidence that risk management worked.
A small planned loss protects capital for future opportunities.
A BOF becomes powerful only when the market continues moving in the expected direction.
In EXIDE, follow-through selling never developed.
That was the first warning sign.
Winning trades often reinforce confidence.
Losing trades improve understanding.
This trade reminds us that no setup is guaranteed.
Most traders only share successful trades.
Professional traders study both winners and losers.
The objective is not to achieve a 100% win rate.
The objective is to:
A single failed BOF does not invalidate the strategy.
It simply reminds traders that markets operate on probabilities, not certainties.
