Select a trading day to view all Scanner results, chart evidence, and market explanations.
2 Scanners Available
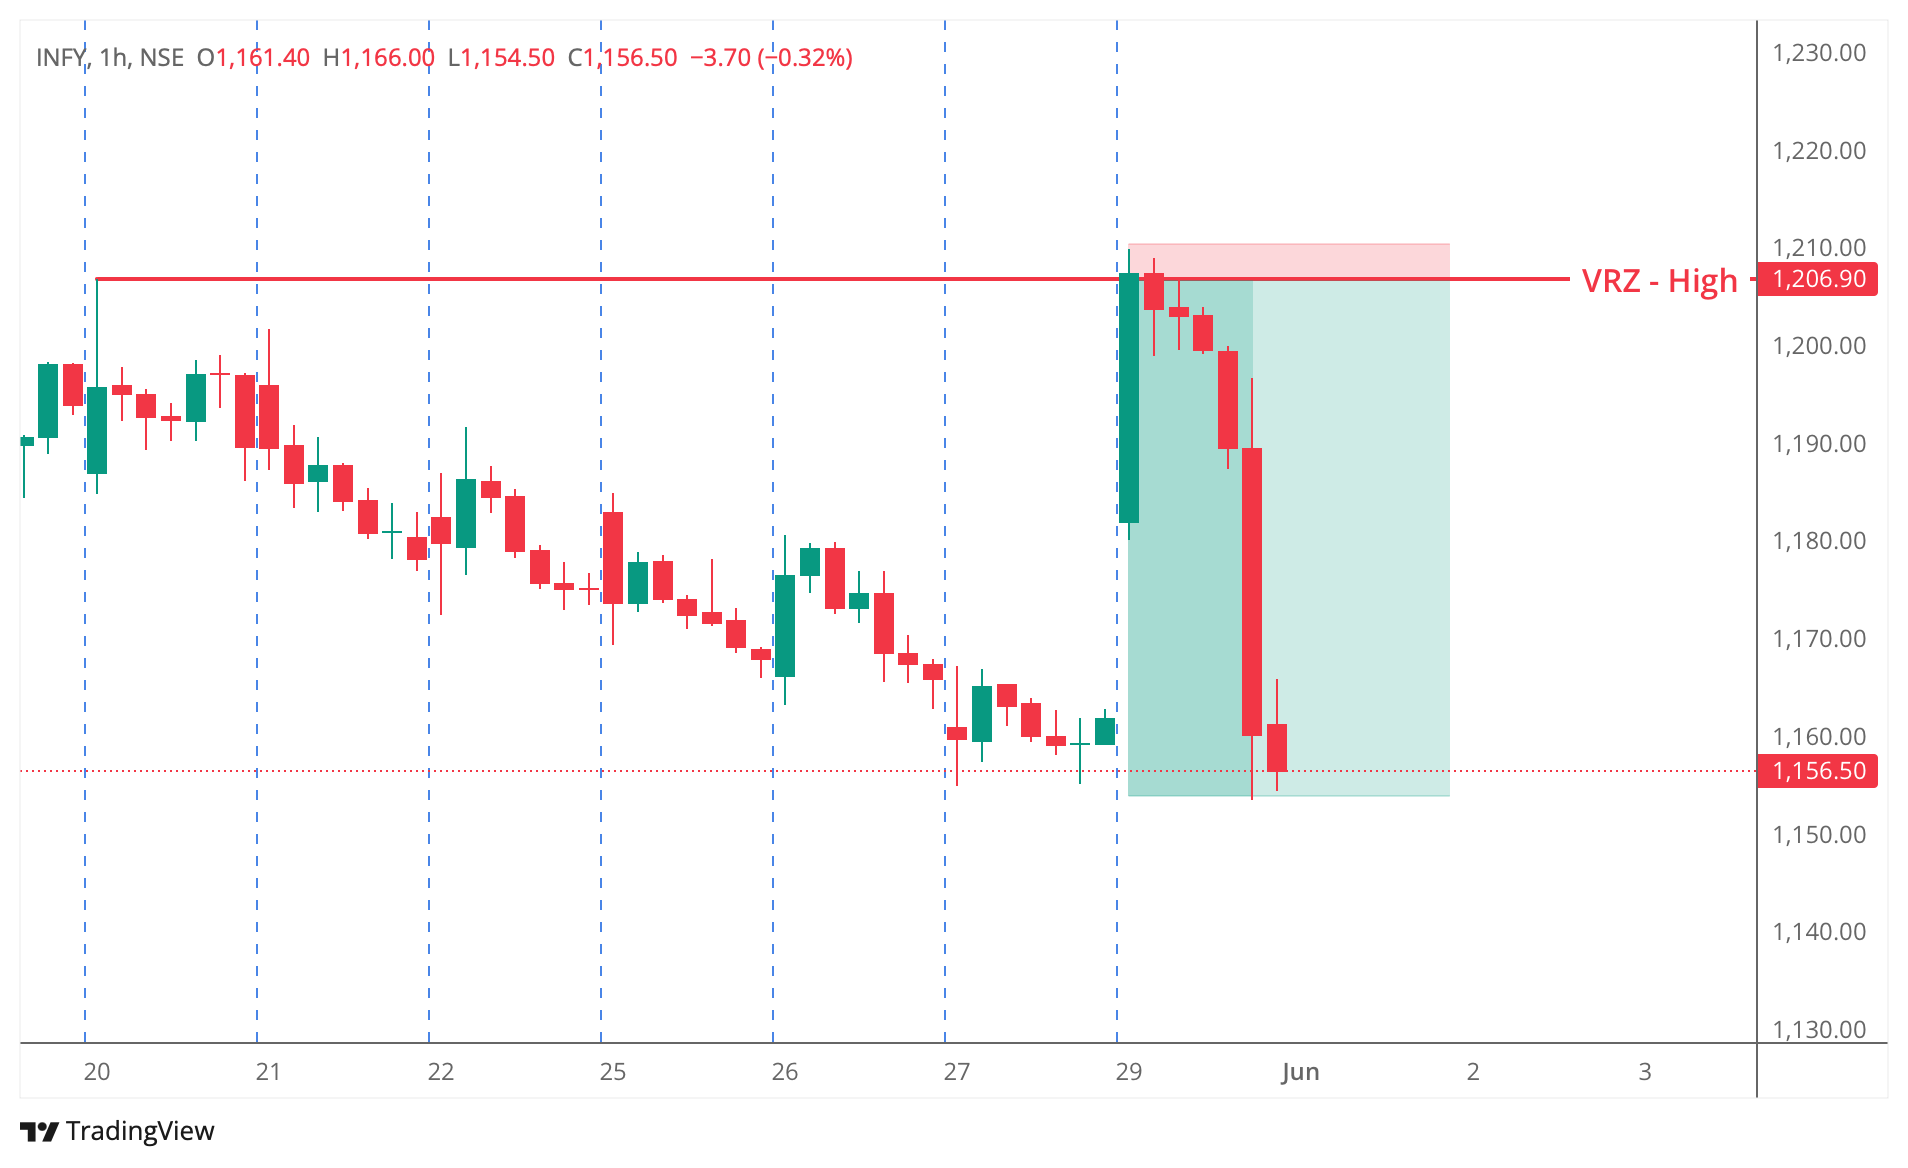
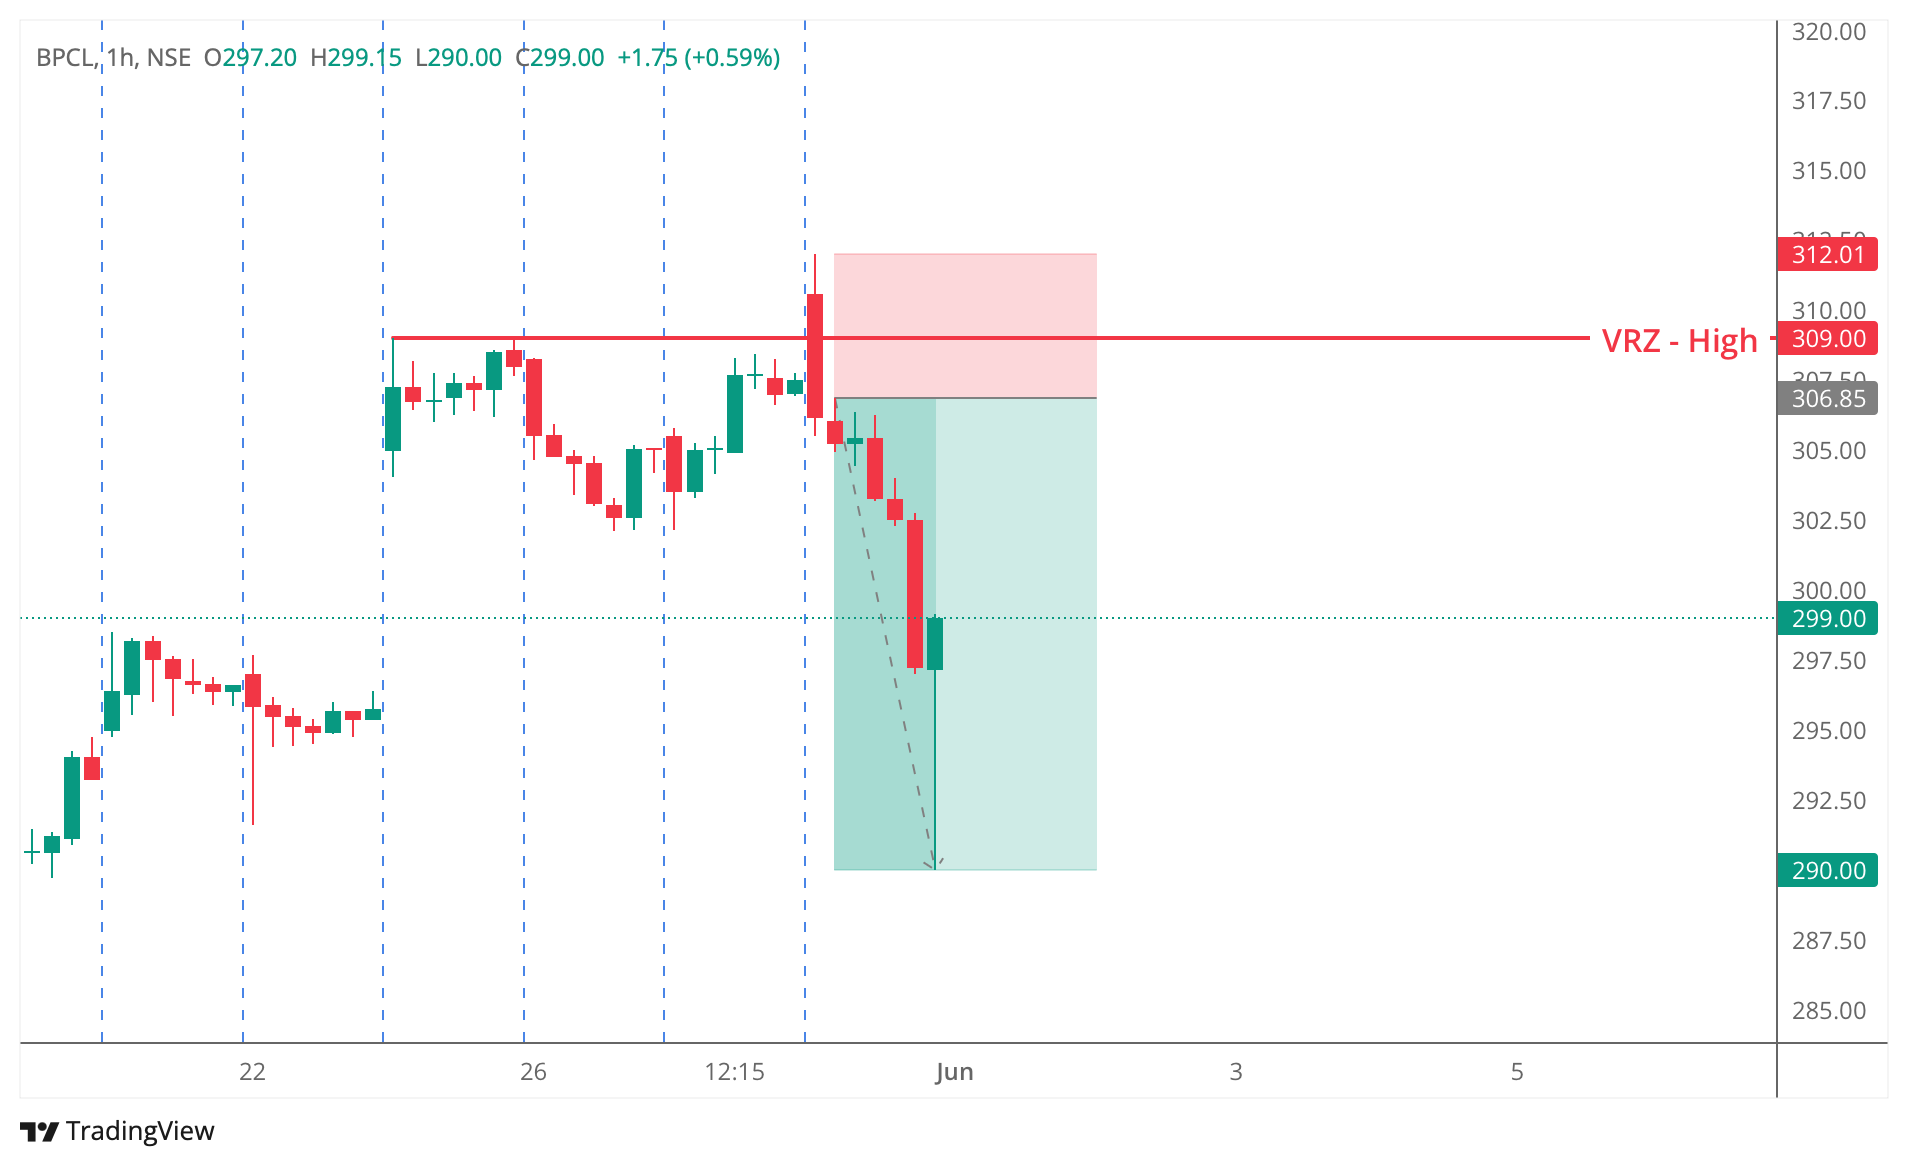
INFY approached a previously identified Visible Reversal Zone (VRZ) High at ₹1,206.90.
The stock successfully moved above the VRZ, creating the appearance of a bullish breakout. This move attracted breakout traders expecting a continuation toward higher levels.
However, the market failed to accept prices above the VRZ.
Instead of continuation buying, strong selling pressure emerged immediately after the breakout. Price quickly moved back below the VRZ and started forming bearish candles.
The inability to sustain above resistance confirmed a Breakout Failure (BOF).
Once the breakout failed, trapped buyers began exiting their positions, accelerating the downside move.
Most market participants are conditioned to believe:
Resistance breaks → Buy the breakout.
As INFY crossed above ₹1,206.90, many traders experienced:
Unfortunately, the market had different plans.
When price failed to sustain above the breakout level:
Started questioning their decision.
Realized momentum was disappearing.
Used the breakout liquidity to distribute positions.
Became forced sellers.
This transition from confidence to fear created the fuel for the sharp decline.
The market often rewards those who observe trader behavior rather than candle patterns.
A breakout above resistance is only the beginning of the story.
The real question is:
Can price sustain above the breakout level?
Many traders focus on price crossing resistance.
Professional traders focus on whether the market accepts that higher price.
INFY showed rejection immediately after the breakout.
Strong moves frequently originate from trader mistakes.
When breakout buyers get trapped, their exits create additional selling pressure.
Even after a breakout, a major VRZ continues to act as a decision-making zone.
Ignoring the zone often leads to poor trade decisions.