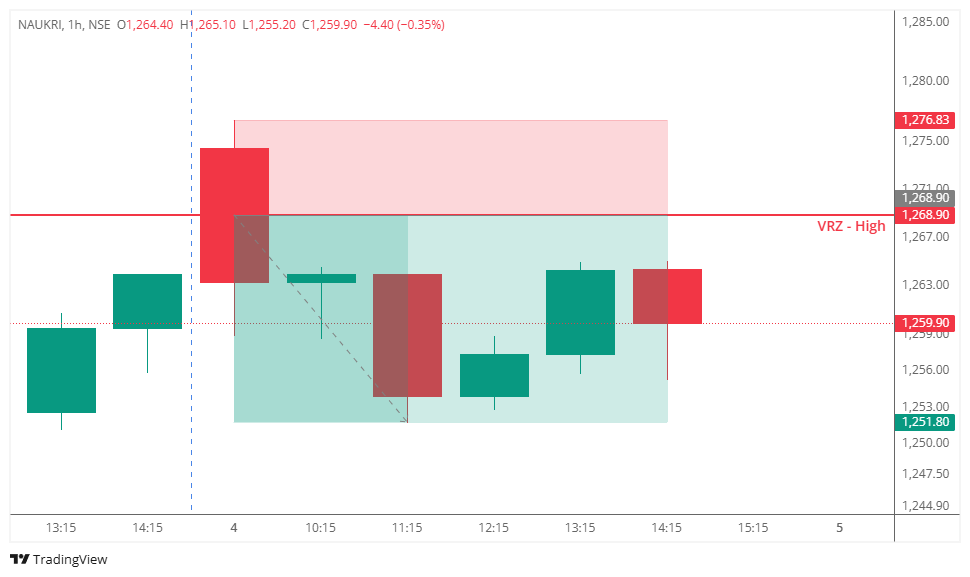

🎯 Info Edge (NAUKRI) approached the previously identified VRZ High at ₹1,268.90 and briefly traded above the resistance zone, creating the impression that a bullish breakout had been confirmed.
📈 The initial breakout encouraged fresh buying as traders anticipated a continuation of the uptrend beyond the key resistance level.
⚠️ However, the breakout failed to sustain.
🔻 Selling pressure quickly emerged, pushing the stock back below ₹1,268.90. The following hourly candles confirmed acceptance beneath the VRZ High, signaling that buyers had lost momentum and sellers had regained control.
✅ This price action confirmed a classic Breakout Failure (BOF) setup.
💥 As the failed breakout became evident, trapped buyers exited their positions while fresh sellers entered the market. The combination of long unwinding and new selling pressure resulted in a 1.35% downside move, successfully achieving the planned 1:2 risk-reward target.
🔍 The rejection near the VRZ High clearly showed that the breakout lacked strong buying conviction.
📊 Every attempt to trade above the resistance zone was met with aggressive selling, preventing buyers from establishing acceptance.
📉 Once the price reclaimed the VRZ High from above and started printing lower candles, bearish momentum strengthened and confirmed the BOF setup.
Many traders believed:
🚀 The breakout above resistance was genuine.
📈 Buyers would continue pushing the stock higher.
🌟 A fresh bullish trend had begun.
The market reacted differently.
🔻 Price quickly slipped back below ₹1,268.90.
😮 Breakout buyers became trapped.
🐻 Sellers regained control near the resistance zone.
📉 Bearish momentum accelerated as long positions were unwound.
💭 This transition from bullish confidence to bearish dominance fueled the successful downside move.
🟢 Buyers initially attempted to sustain the breakout above the VRZ High.
🔴 Sellers aggressively defended the resistance zone and rejected higher prices.
⚖️ The failed breakout encouraged fresh short positions while forcing breakout buyers to exit.
📉 The combined effect of long unwinding and new selling pressure accelerated the bearish trend.
🔹 A Breakout Is Confirmed Only by Sustained Acceptance
Temporary moves above resistance are not enough. Price must continue holding above the VRZ High to validate the breakout.
🔹 Fast Rejections Often Signal Institutional Selling
The quick move back below ₹1,268.90 reflected strong selling interest and weak buyer conviction.
🔹 Failed Breakouts Can Offer High-Probability BOF Trades
When breakout buyers become trapped, their exits often amplify bearish momentum.
🔹 Patience Improves Trade Quality
Waiting for confirmation below the VRZ High helped identify a disciplined BOF short setup with clearly defined risk.
✅ Wait for confirmation instead of chasing the breakout.
✅ A rejection from the VRZ High often provides a higher-probability entry than the initial breakout.
✅ Risk management remains essential, even in high-conviction BOF setups.
✅ Let price action confirm the shift in market control before entering a trade.