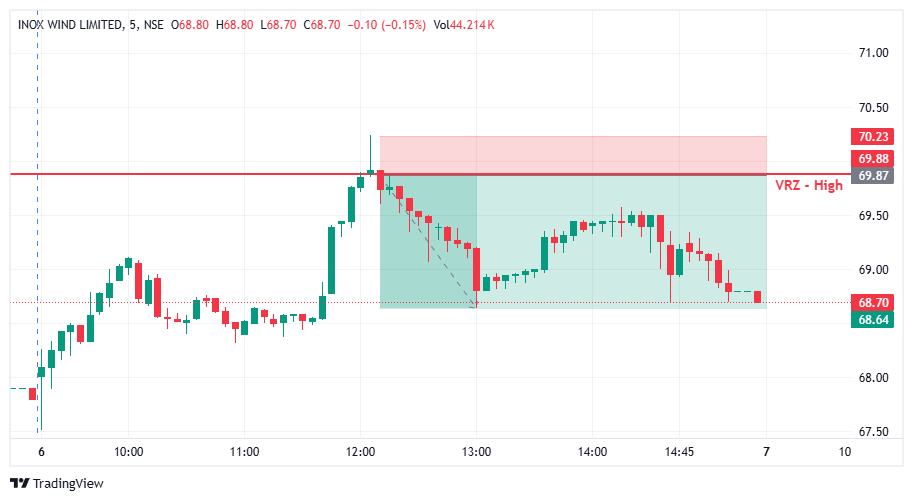

🔎 INOXWIND developed strong bullish momentum before moving toward the ₹69.87 VRZ High.
⚠️ Price pushed into the resistance area, creating a potential breakout scenario above the established zone.
🎯 The VRZ High became the key technical reference for identifying a possible bearish breakout failure.
🚨 Price tested the ₹69.87 VRZ High and moved into the resistance area.
🪤 However, buyers failed to sustain acceptance above the key zone.
🔻 Selling pressure emerged near the resistance, causing price to reverse back below the VRZ High.
🎯 The rejection from the VRZ High developed into a Bearish Breakout Failure structure.
⚡ The inability to hold higher levels indicated weakening bullish momentum.
📉 Once price moved back below the resistance zone, sellers gained short-term control and the bearish reversal strengthened.
🔻 Following the VRZ High rejection, INOXWIND continued to move lower.
📊 The bearish price structure developed through successive lower levels as selling pressure expanded.
💥 Price eventually reached the ₹68.64 area, producing the reported 1.76% downside move.
🔎 The setup featured a strong upside approach toward resistance followed by a failed breakout.
🔴 The ₹69.87 VRZ High acted as the critical resistance reference.
📉 Rejection from the zone shifted the short-term structure from bullish momentum to bearish price action.
🎯 The subsequent decline confirmed the effectiveness of the failed breakout setup.
🔎 The primary signal was the failed breakout above the ₹69.87 VRZ High.
⚠️ Buyers attempted to push price through resistance but failed to sustain higher levels.
🔄 The subsequent rejection and move back below the VRZ High indicated a shift in short-term market control.
📉 Sellers then extended the downside move, resulting in the reported 1.76% price decline.
🔴 VRZ High: ₹69.87 acted as the primary resistance reference.
🚨 Breakout Attempt: Buyers tested higher levels but failed to sustain acceptance.
🔻 Resistance Rejection: Sellers emerged strongly around the VRZ High.
📉 Bearish Confirmation: Price moved back below the key resistance zone.
⚡ Momentum Shift: Short-term control shifted from buyers to sellers.
🎯 Downside Expansion: Price moved toward the ₹68.64 area.
🏆 Trade Outcome: 1.76% downside with 1:3 RR
🎯 The ₹69.87 VRZ High provided a clear technical reference for evaluating the bearish BOF setup.
⚖️ The reported 1:3 Risk-to-Reward highlights the structured relationship between the defined trade risk and potential reward.
🧠 Predefined invalidation, appropriate position sizing, and disciplined execution remain important when trading Breakout Failure setups.