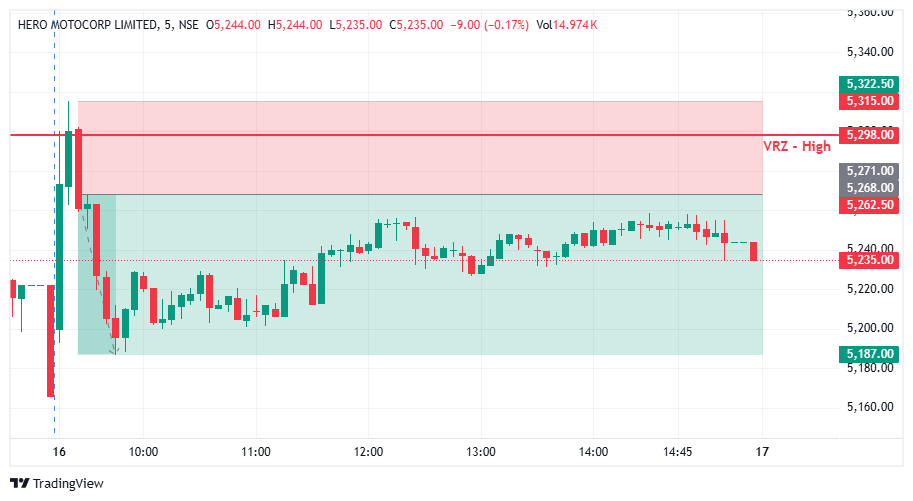

📊 HEROMOTOCO experienced strong price movement before approaching the key ₹5,298.00 VRZ High resistance zone.
⚠️ The initial upward movement brought price directly into an important resistance area, where buyers attempted to sustain the breakout.
🎯 The VRZ High became a critical technical reference for identifying a potential bearish Breakout Failure.
🚨 Price tested and briefly moved around the ₹5,298.00 VRZ High, indicating an attempt to break above the marked resistance.
🪤 However, the breakout failed to sustain, and buyers were unable to establish continued acceptance at higher levels.
🔻 Selling pressure emerged near the resistance zone, signaling a possible shift in short-term momentum.
🎯 The rejection from the VRZ High developed into a clear Bearish Breakout Failure (BOF) structure.
⚡ Once price moved back below the resistance area, sellers began gaining control of the immediate price action.
📉 The failed breakout indicated that the upward momentum had weakened and a potential downside reversal was developing.
🔻 Following the VRZ High rejection, HEROMOTOCO moved lower as bearish momentum expanded across the session.
📊 Price gradually established lower levels after the failed breakout, confirming the bearish price structure.
💥 The downside move eventually extended toward the ₹5,187.00 area, delivering a significant intraday reversal.
📉 The successful BOF setup generated a 1.54% downside move from the resistance rejection area.
⚡ The sustained selling pressure demonstrated how a failed breakout can quickly transition into a strong bearish reversal.
🏆 With disciplined risk management, the setup achieved a 1:2 Risk-to-Reward ratio.
🔎 The key technical development in this setup was the failed breakout above the ₹5,298.00 VRZ High.
⚡ Buyers attempted to push price higher, but the move could not sustain above resistance.
🔄 The subsequent rejection and move back below the VRZ High shifted the short-term market structure in favor of sellers.
📉 This combination of resistance failure, bearish momentum, and price expansion created the successful BOF opportunity.
🔹 VRZ High: ₹5,298.00 acted as the primary resistance level.
🔹 Breakout Attempt: Buyers tested the resistance but failed to sustain higher prices.
🔹 Rejection: Selling pressure emerged around the VRZ High.
🔹 Bearish Confirmation: Price moved back below the resistance zone.
🔹 Momentum Shift: Sellers regained short-term market control.
🔹 Downside Target Area: ₹5,187.00.
🔹 Trade Outcome: 1.54% downside with 1:2 RR.
🎯 A clearly defined VRZ High provided an important technical reference for the bearish setup.
⚖️ The 1:2 RR outcome highlights the importance of balancing potential reward against controlled trade risk.
🧠 Proper position sizing, predefined risk, and disciplined execution remain essential when trading Breakout Failure setups.